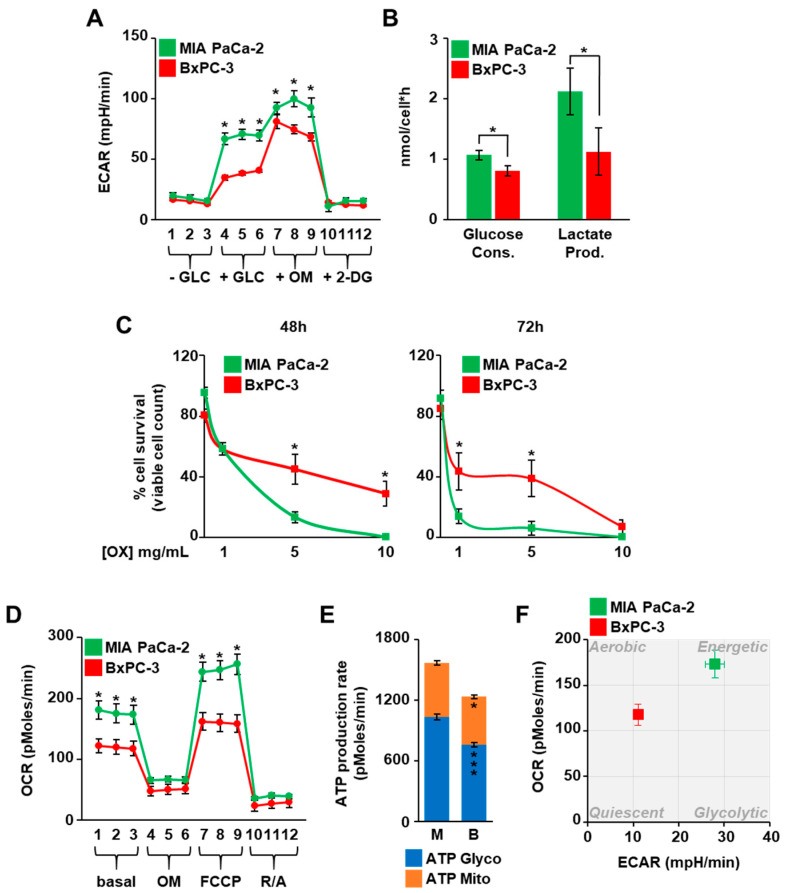
Figure 1.
KRASmut MIA PaCa-2 cells are more glycolytic than KRASwt BxPC-3. (A) The extracellular acidification rate (ECAR) of MIA PaCa-2 and BxPC-3 cells throughout a glycotest assay was measured using the Seahorse XF24 Analyzer. (B) The glucose consumption and lactate production were calculated measuring the amount of glucose and lactate in cell media of MIA PaCa-2 and BxPC-3. (C) MIA PaCa-2 and BxPC-3 cells were cultured in presence of the glycolysis inhibitor oxamate (OX) and counted at the indicated time points using the Trypan Blue stain. (D) The oxygen consumption rate (OCR) of MIA PaCa-2 and BxPC-3 cells throughout a mitostress test was measured using Seahorse XF24 Analyzer. (E) The production rate of the ATP due to the glycolysis (ATP Glyco) and the mitochondrial respiration (ATP Mito) was evaluated in MIA PaCa-2 and BxPC-3 cells by performing the specific assay with the Seahorse XFe96 Analyzer. (F) The XF Energy Map was determined using the Seahorse profiles. All data represent the mean ± SEM of at least three independent experiments. * p < 0.05, *** p < 0.001 (Student’s t-test), MIA PaCa-2 vs. BxPC-3.

