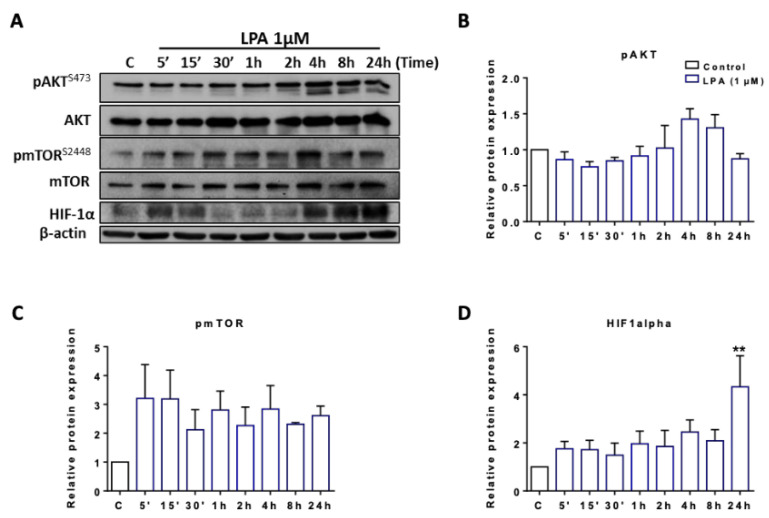
Figure 3.
Immunoblot analysis of proteins involved in glycolysis upon treatment with LPA. (A) Serum-starved BV-2 cells were incubated in the absence (c) and presence of 1 µM LPA for the indicated time points. Expression levels of energy/oxygen sensing proteins were examined by immunoblotting. One representative blot out of three is shown. β-actin was used as loading control. Bar graphs represent densitometric analyses of immunoreactive bands of (B) phosphorylated AKT (pAKT), (C) phospho mTOR (pmTOR), and (D) HIF1α relative to β-actin. Results are presented as mean values ± SEM of 3 independent experiments. (** p < 0.01 compared to control; one-way ANOVA with Bonferroni correction).

