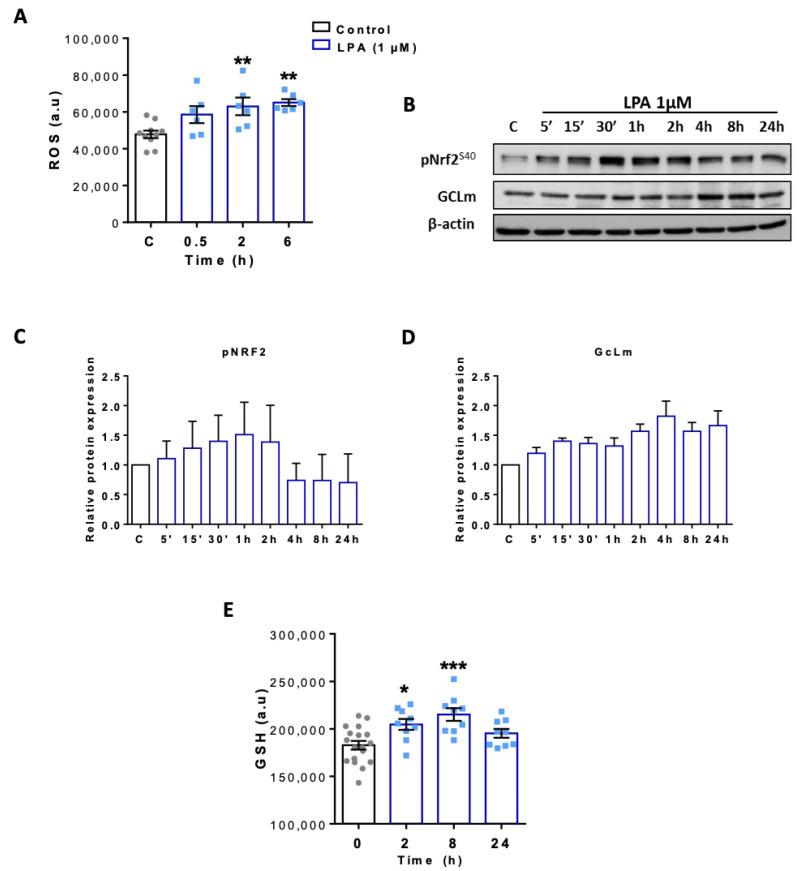
Figure 7.
Characterization of the antioxidant response in LPA treated BV-2 cells. (A) Reactive oxygen species (ROS) of control and LPA (1 µM) treated cells was quantified using the ROS-ID® Total ROS Detection kit (a.u. arbitrary units). (B) Immunoblot analysis of phospho Nrf2 (Ser40) and GCLm upon treatment with LPA. One representative blot out of three is shown. β-actin was used as loading control. (C,D) Densitometric analysis relative to β-actin from three independent immunoblot experiments are presented. (E) Glutathione (GSH) concentration of LPA (1µM) treated cells was quantified with GSH-Glo Assay kit and compared with controls in three independent experiments. Results are presented as mean values ± SEM (* p < 0.05, ** p < 0.01, *** p < 0.001, compared to control; one-way ANOVA with Bonferroni correction).

