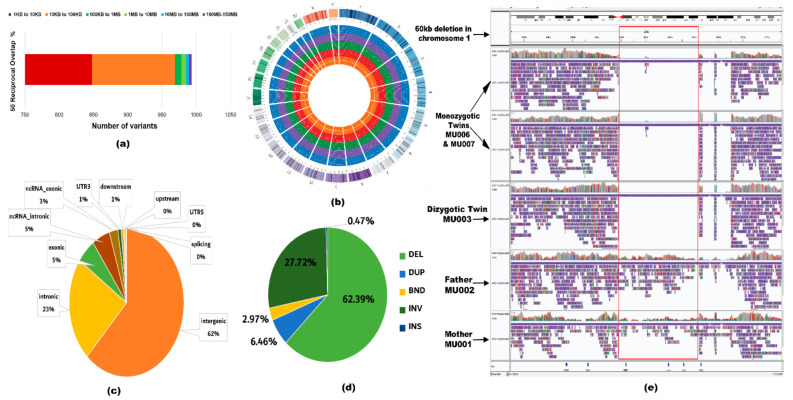
Figure 3.
Characteristics of the structural variants (SV) belonging to the ‘golden set’. (a) Distribution of SV length in the ‘golden set’ of variants. In the stacked bar chart, each color bar portrays the number of variants belonging to a range of SV lengths spanning from 1 kb to 150 Mb. (b) A circos genome map demonstrating variants based on different classes of SVs per chromosome. Considering the concentric circles from the innermost circle to the outermost, the orange circle depicts deletions, the red circle depicts duplications, the green circle depicts inversions, the purple circle depicts insertions, the blue circle depicts the breakends, and the multi-color outermost circle indicates the location of the chromosome. Each dot on the concentric circles represents a variant of the ‘golden set’. (c) Identification of the coding and non-coding elements overlapping with the variants represented in a pie chart. (d) Evaluating the number of genes overlapping with different types of SVs. Each slice describes a type of SV (deletion, duplication, inversion, insertion, or breakend) and the percentage describes the portion of genes overlapping with that SV type. (e) Screenshot of the alignment of the 60 kb de novo deletion detected by LRS sequencing, visualized using Integrative genomics viewer (IGV). From top to bottom, the alignment is as follows: MU007 and MU006 (monozygotic twins), MU003 (dizygotic twin), MU002 (father), and MU001 (mother). The blank lines in the alignment of MU007, MU006, and MU003 show the homozygous deletion in the OR4C11 gene. It is clear from the alignment of the reads that this deletion is present only in the proband and not in the parents.

