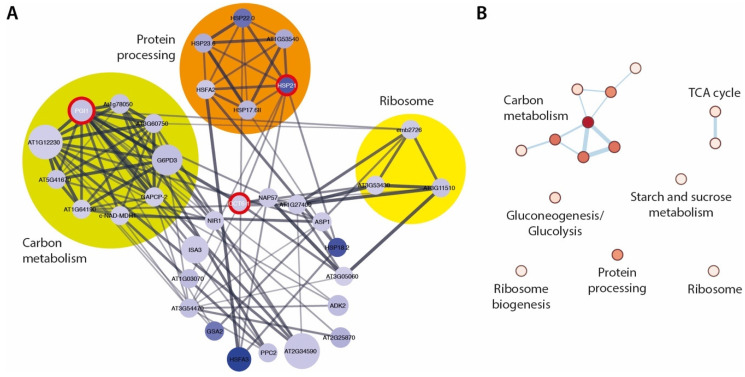
Figure 5.
Network analysis of downregulated differentially expressed genes (DEGs) in ami1 rty. (A) Extracted network for the three DEGs with the highest betweenness centrality. The central hubs CCT6-1, HSP21, and PGI1 are highlighted by red circles. The nodes are color coded according to the log2FC expression levels of the DEGs (white to blue), with dark blue marking the most repressed DEGs. The node size describes the false discovery rate (FDR) values, while the edge thickness reflects the betweenness score between the nodes. Densely connected nodes have been identified by using the Molecular Complex Detection (MCODE) clustering algorithm and are highlighted by colored circles. (B) Kyoto Encyclopedia of Genes and Genomes (KEGG) pathway enrichment analysis of the sub-network extracted for CCT6-1, HSP21, and PGI1. The color (white to red) gives account on the normalized enrichment score of the corresponding KEGG pathway.

