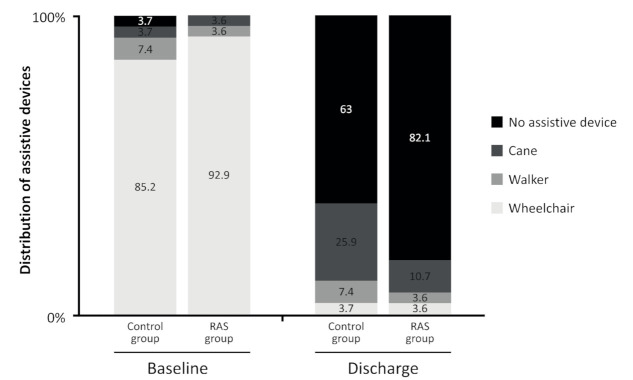
Figure 3.
Assistive devices by groups at baseline and discharge. Note: The figure shows the distribution (as percentages) of assistive devices used by the participants in each group at baseline and at discharge. No differences are found (p value > 0.05) by Chi-square test between groups at baseline or discharge.

