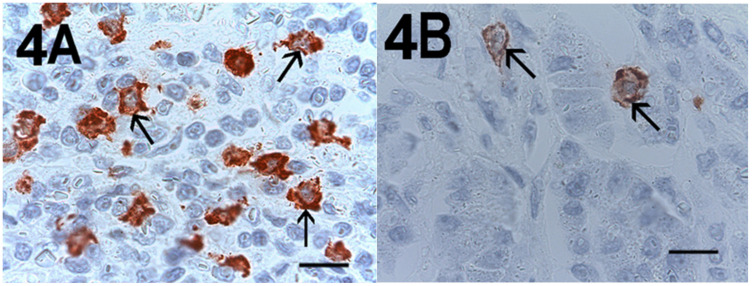
Figure 4.
Magnification ×1000 in oil, 0.06 mm2 area, immunostaining with the anti-CD117 antibody. (A) Very high MCDP-c-KitR in primary PDAT section. Small arrows indicate single red-immunostained MCs. The big arrow indicates tumour epithelium. (B) Low MCDP-c-KitR in ANT section. Small arrows indicate single red-stained mast cells. Please note the filiform membranes in immunostaining. Scale bar corresponds to 150 µm.

