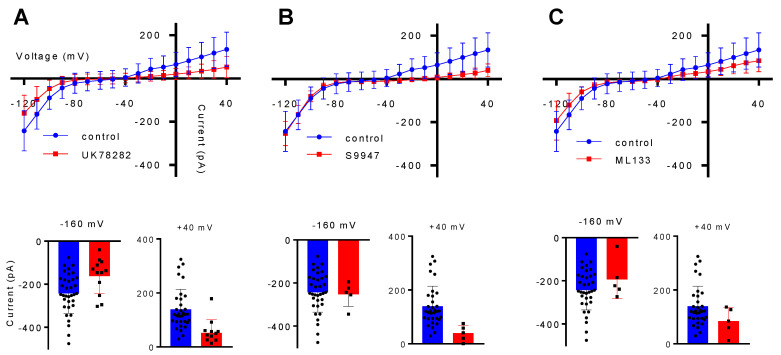
Figure 2.
Electrophysiological properties of BV2 cells. For all Kv1.3, Kv1.5 and Kir2.1 potassium channels, the electrophysiological characteristics are represented by the intensity/voltage (I/V) curves extracted from the step recordings, representing the total current elicited by a voltage protocol starting from −120 mV, in 10 mV increments, to +40 mV (A–C), in control conditions and after each specific inhibitor. The inhibition effect of the of each blocker can be seen from the I/V curves. The insets represent the comparison of the current amplitude elicited by a voltage step at −160 mV and +40 mV. All the data are represented as Mean ± SD (n = 3 independent experiments).

