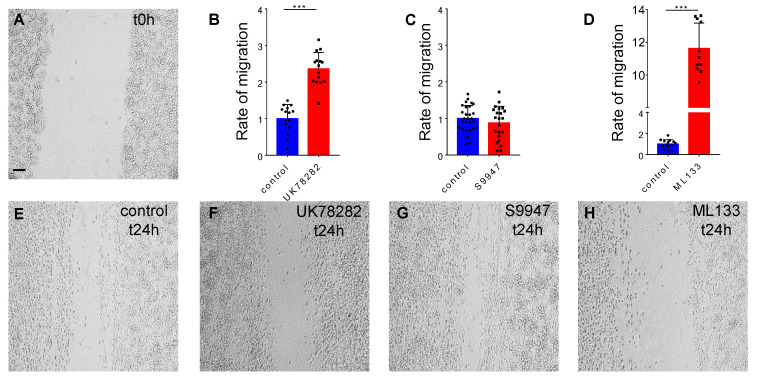
Figure 3.
The contribution of potassium channels in BV2 microglial migration. The representative images show the robust and repetitive scratch made with the 200 µL sterile pipette tip at t0h (A) and the cell migration in control conditions (E) and after the inhibitor at t24h (F–H). The histograms show that BV2 microglial cells migrate less after the inhibition of Kv1.3 and Kir2.1 (B,D), whereas blocking Kv1.5 has no effect on cellular migration (C). Scale bar: 100 µm. All the statistical analysis is represented as Mean ± SD, ***: p < 0.001, using the parametric t-test (n = 3 independent experiments).

