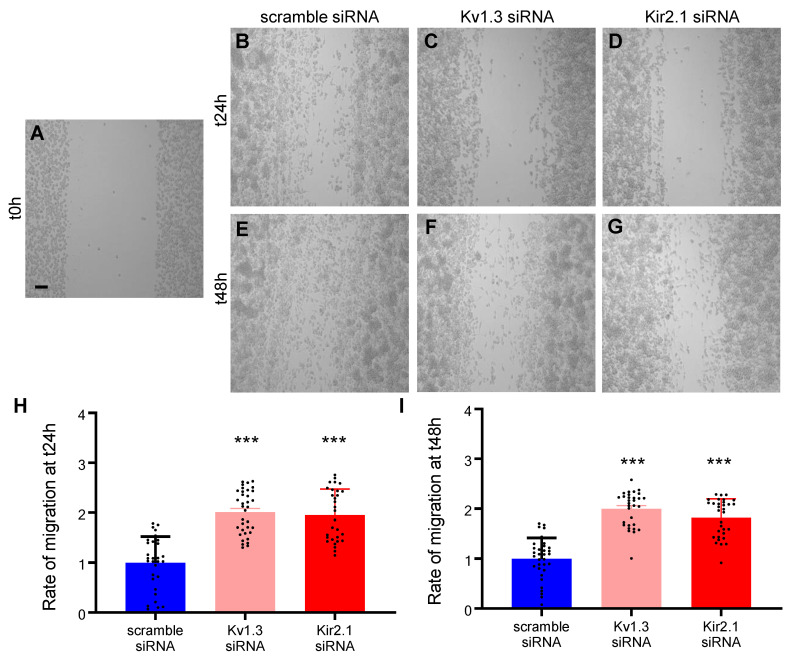
Figure 4.
BV2 microglial migration after the silencing of the Kv1.3 and Kir2.1 channels. The representative images show the scratch made with the 200 µL sterile pipette tip at t0h (A) and the cell migration after scrambled and silencing siRNA at t24h (B–D) and at t48h (E–G). The bar graphs show the BV2 migration after scrambled and silencing siRNA at t24h (H) and at t48h (I). Scale bar: 100 µm. All the statistical analysis are represented as Mean ± SD, ***: p < 0.001, using the parametric t-test (n = 3 independent experiments).

