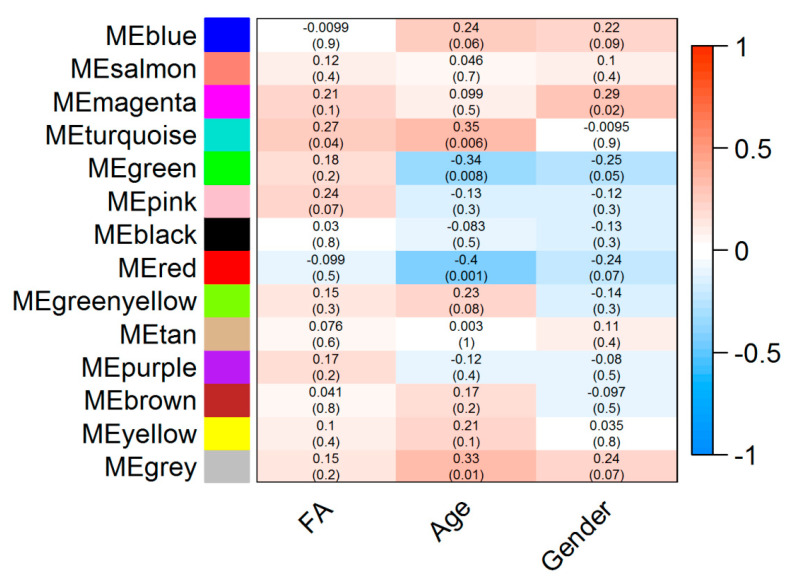
Figure 1.
Module-trait associations. Each row corresponds to a module eigengene (ME) while each column corresponds to either phenotype (FA: Food allergy) or demographic traits such as age and gender. Each cell contains the corresponding correlation coefficient (display at the top of the cell) and corresponding p-values for each module (display at the bottom of the cells within parentheses). Blue and red colours of the spectrum on the right denote low and high correlation, respectively.

