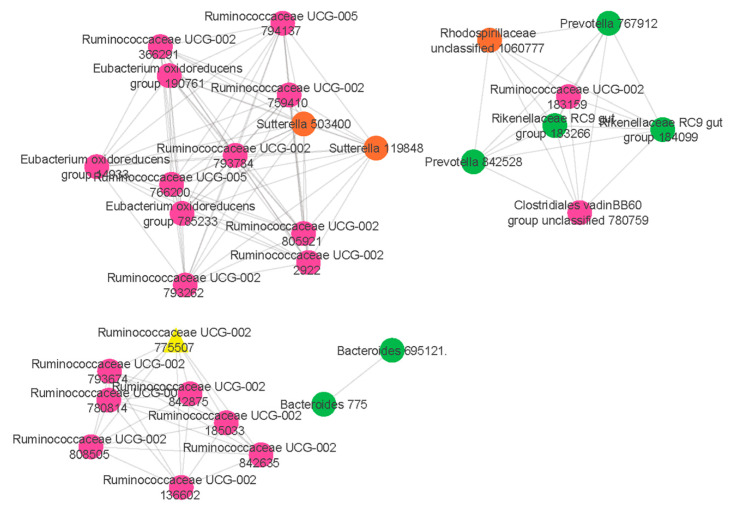
Figure 2.
Network analysis identifies a distinct module of co-associated taxa. The highly correlated taxa in the comparisons of food allergic children and non-food allergic children are indicated and colour coded according to the phylum. Green colour represents Bacteroidetes phylum, pink colour represents Firmicutes phylum while orange colour represents Proteobacteria phylum. Hub taxon (yellow triangle) exhibits greatest intramodular connectivity, whereas connector taxa (circles) exhibit a higher frequency of intramodular connectivity.

