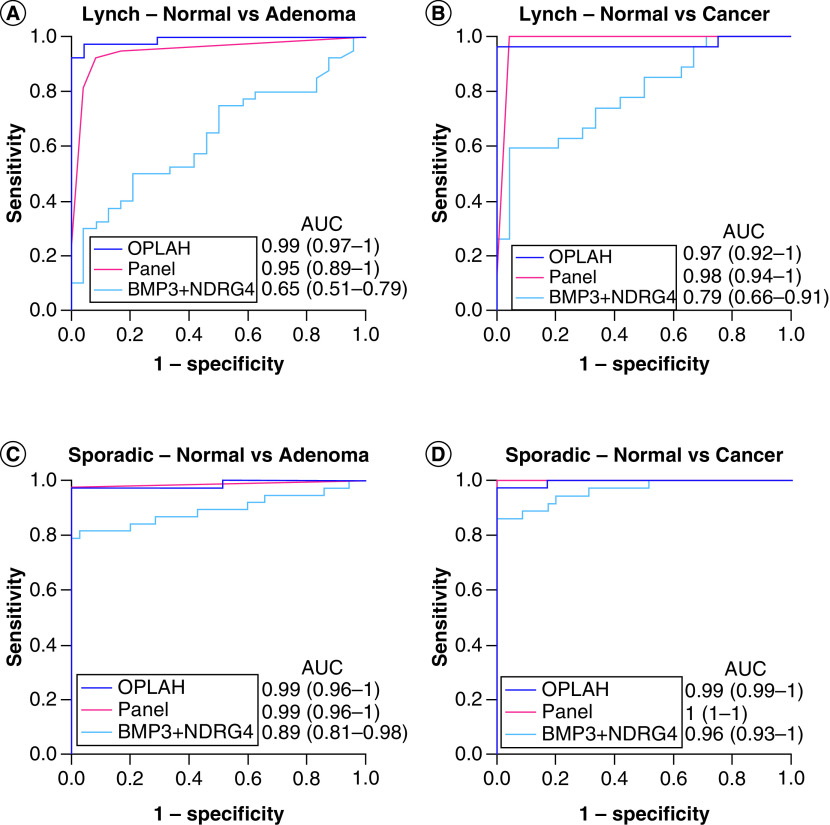
Figure 3. . Discrimination of selected methylated DNA marker candidates for colorectal neoplasia as assessed by receiver operator curves.
AUC in each graph are shown for OPLAH alone, a panel of novel methylated DNA markers without OPLAH (ARHGEF4, LRRC4, ANTXR1, PITX1) and the combination of BMP3 + NDRG4 with (A) Lynch adenomas, (B) Lynch cancers, (C) sporadic adenomas and (D) sporadic cancers.
AUC: Area under the curve.

