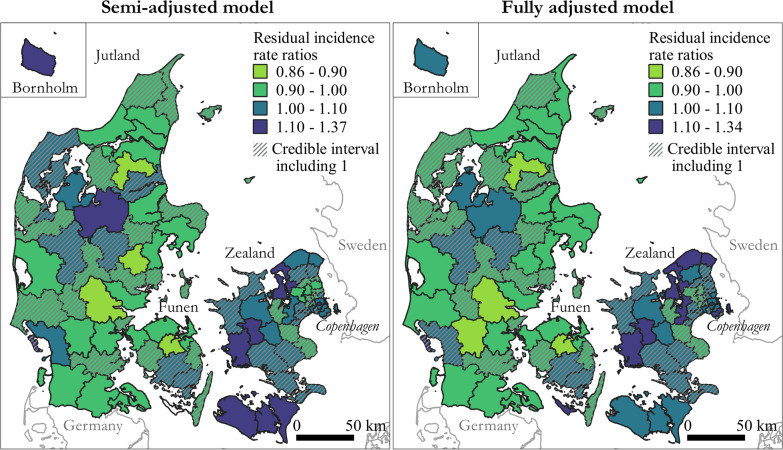
Fig. 3.
Geographical distribution of the residual incidence rate (IR) ratios of atrial fibrillation (AF) (including atrial flutter) at municipality level compared with country mean (2011–2015) for the semi-adjusted model, adjusted for age and sex and random effect of municipality, and the fully adjusted model, additionally adjusted for socioeconomic position. Municipalities where the residual AF IR is not significantly different from the country mean (i.e. the 95% credibility interval include 1) are grey shaded. Maps contain data from © EuroGeographics for the administrative boundaries and from The Danish Agency for Data Supply and Efficiency, municipality borders, 2019

