Fig. 1.
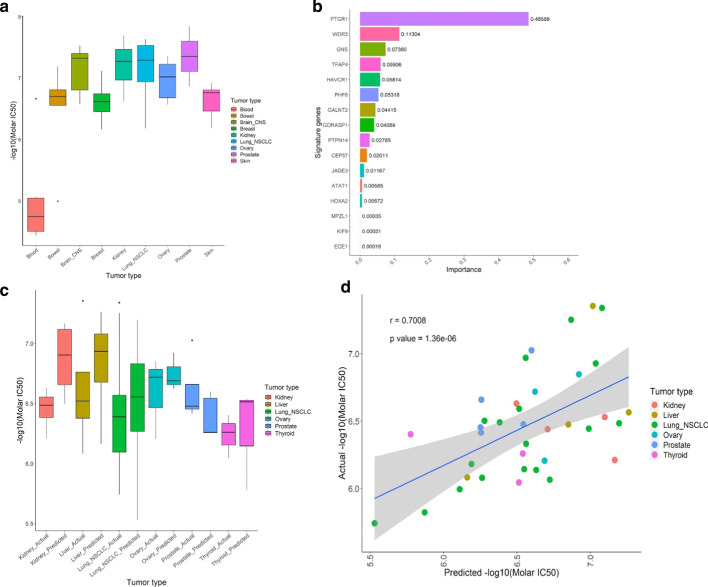
Comparison between actual and predicted LP-184 IC50 values. a Sensitivity profile of LP-184 in the 52 cell lines grouped by tumor type from NCI-60 panel. b Gene signature predictive of LP-184 response. c This boxplot shows proximity between actual and predicted LP-184 IC50 values (− log10 (Molar IC50)) on Y axis for individual tumor types on X axis from the blind test set of 37 solid tumor cell lines. d This graph shows Pearson correlation between actual and predicted LP-184 IC50 values from the blind test set of 37 solid tumor cell lines, covering 6 tumor types

