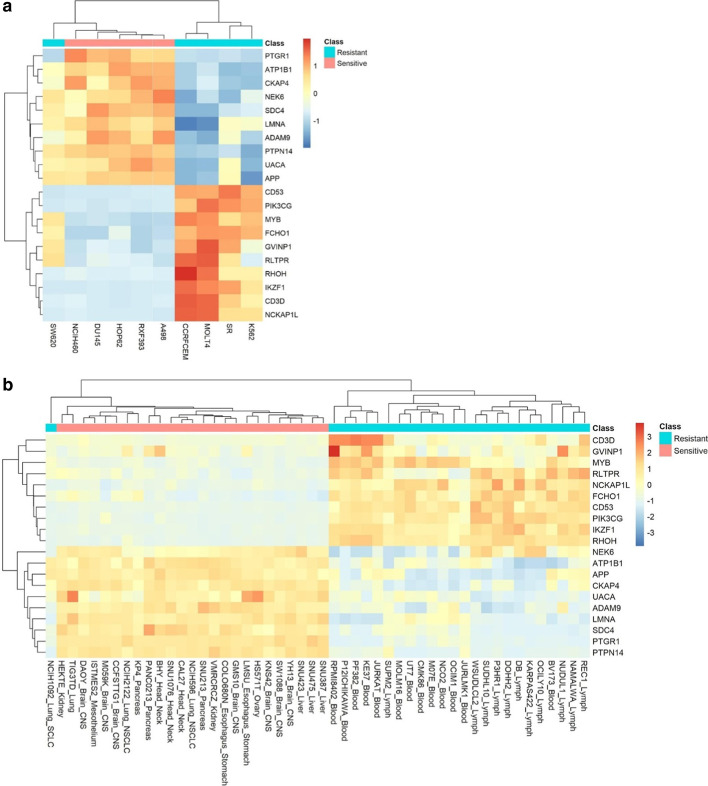
Fig. 2.
Co-clustering between genes highly correlated with LP-184 sensitivity in training set and cell lines subgroups. a This heat map displays the clustering pattern across the top 5 cell lines known to be sensitive and resistant to LP-184 (from actual IC50 in NCI-60 data) arranged in vertical columns and the top 20 correlated genes (10 positively correlated and 10 negatively correlated) with actual known LP-184 sensitivity arranged in horizontal rows. b This heat map displays the clustering pattern across the top 25 cell lines predicted sensitive and resistant to LP-184 (from predicted IC50 in CCLE testing data) arranged in vertical columns and the top 20 correlated genes (10 positively correlated and 10 negatively correlated) with actual known LP-184 sensitivity arranged in horizontal rows

