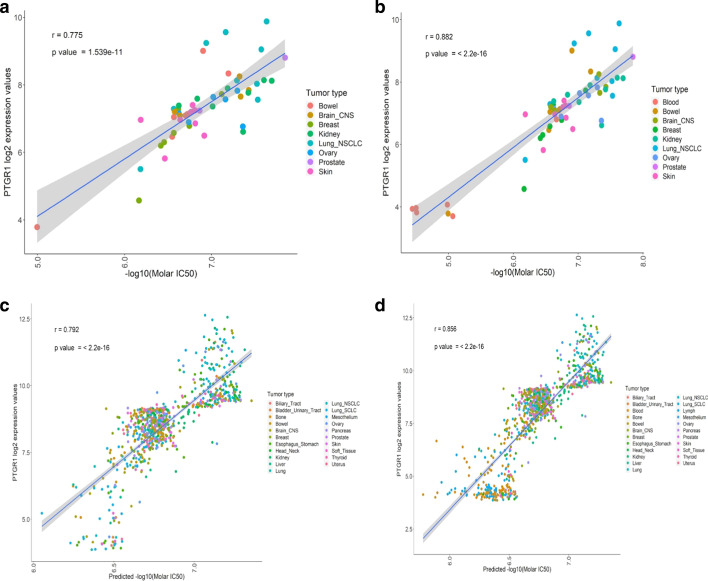
Fig. 3.
Correlation between PTGR1 transcript level (Y axis) and observed or predicted LP-184 IC50s (X axis). a PTGR1 gene expression correlation with actual IC50 from NCI-60 solid tumor cell lines (excluding blood) PTGR1 expression correlation from 52 NCI-60 solid tumor cell lines with LP184 drug sensitivity shows strong and significant (p value 1.539e−11) Pearson correlation (correlation coefficient r = 0.775). b PTGR1 gene expression correlation with actual IC50 from all NCI-60 cancer cell lines (including blood). c PTGR1 gene expression correlation with predicted IC50 from CCLE solid tumor cell lines (excluding blood and lymph). d PTGR1 gene expression correlation with predicted IC50 from all CCLE cell lines (including blood and lymph)

