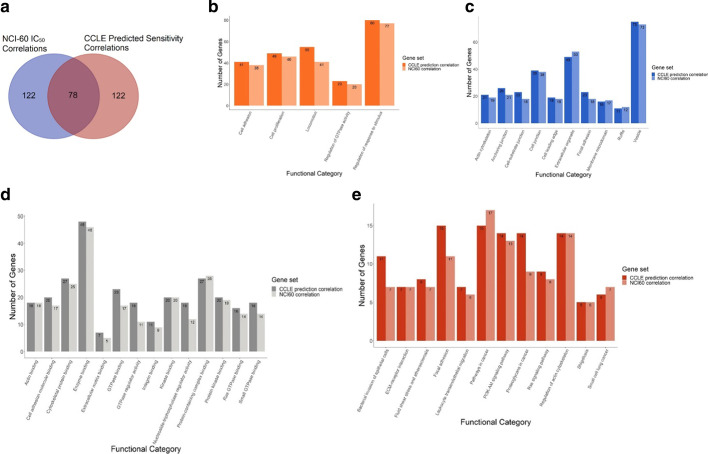
Fig. 5.
Overlap between and functional enrichment of LP-184 correlated genes from training and test sets. a This Venn diagram shows common genes between NCI-60 correlation with actual LP-184 sensitivity, and CCLE correlation with predicted LP-184 sensitivity. Bar charts show common GO enriched categories from b biological process, c cellular component, d molecular function aspects and e signaling pathway from KEGG (Kyoto Encyclopedia of Genes and Genomes), between NCI-60 top correlated genes and CCLE top correlated genes. Top 20 significant (FDR < = 0.05) GO enrichments were selected for comparison

