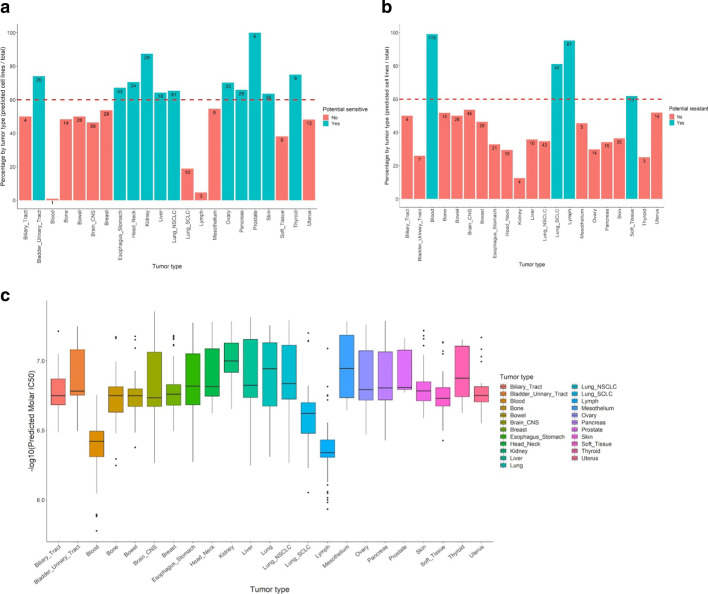
Fig. 6.
Potential LP-184 sensitive and resistant tumor types from the test set predictions. a This bar chart shows tumor types potentially sensitive to LP-184, highlighted in green. Y axis represents the percentage of cell lines by tumor type predicted as sensitive to LP-184, and X axis shows various tumor types. b This bar chart shows tumor types potentially resistant to LP-184, highlighted in red. Y axis represents the percentage of cell lines by tumor type predicted as resistant to LP-184, and X axis shows various tumor types. c This box plot shows the spread of predicted LP-184 IC50 values across multiple tumor types represented in the CCLE

