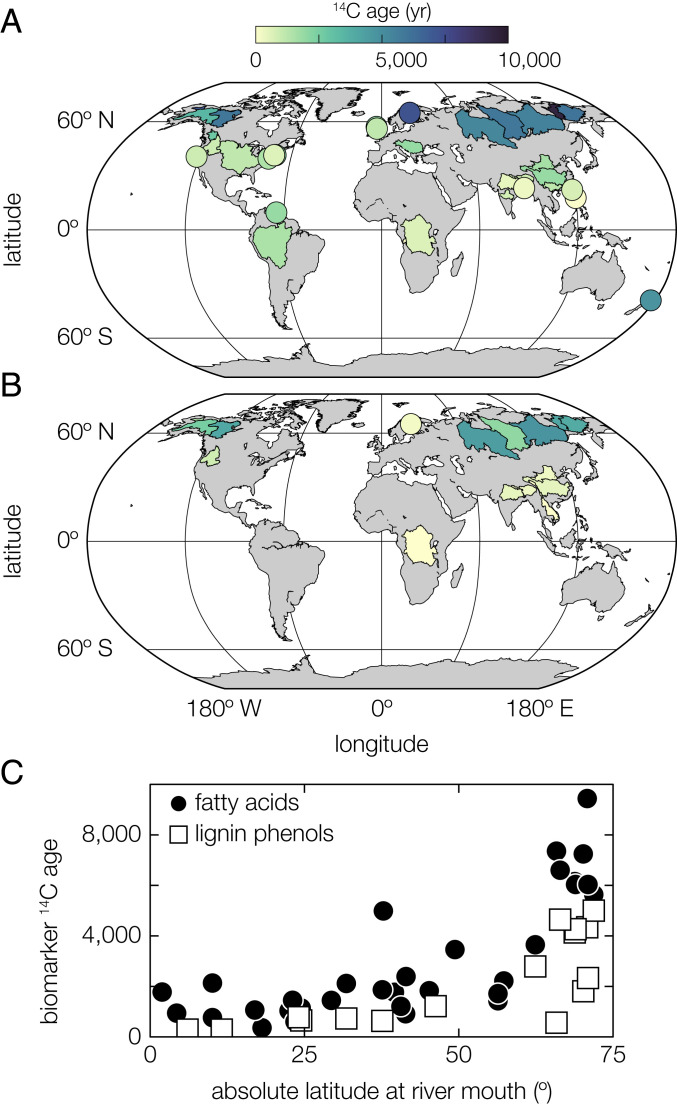
Fig. 1.
Riverine biomarker 14C ages. The catchment areas of all rivers analyzed in this study are color coded by (A) plant-wax fatty-acid and (B) lignin-phenol 14C ages (SI Appendix, Table S1). Rivers with catchment areas smaller than 30,000 km2 are shown as colored circles for clarity. The legend above (A) applies to both panels. (C) Biomarker ages as a function of the absolute latitude at the river mouth, showing both fatty acids (black circles) and lignin phenols (white squares).

