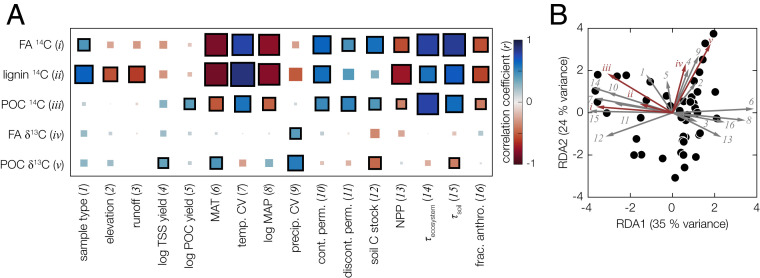
Fig. 2.
Multivariate statistical analysis. (A) Matrix of Pearson correlation coefficients (r values) between environmental control variables (x-axis) and POC and biomarker 14C and δ13C responses (y-axis) (SI Appendix, Table S4). Box sizes and colors correspond to the strength of the correlation (sizes: magnitude only; colors: magnitude and sign). Correlations that are significant at the P = 0.05 level are outlined with a thick, black border. “Sample type” refers to the following: suspended sediment, bank/bedload sediment, or shelf-deposit sediment. (B) RDA triplot showing the RDA1 and RDA2 canonical axes (SI Appendix, Table S5); labels show the percent of total sample variance explained by each axis. Environmental control variable loadings are plotted as gray arrows, POC and biomarker 14C and δ13C response variable loadings are plotted as red arrows, and individual sample scores are plotted as black circles. Environmental and response variable loadings are scaled for visual clarity. Numbers and roman numerals correspond to control and response variables, respectively, as listed in (A). Only control variables that are statistically significantly correlated with at least one response variable are included in the analysis (SI Appendix, Table S4). TSS, total suspended sediment; POC, particulate organic carbon; CV, coefficient of variation; cont. perm., continuous permafrost cover; discont. perm., discontinuous permafrost cover; MAP, mean annual precipitation; NPP, net primary production.

