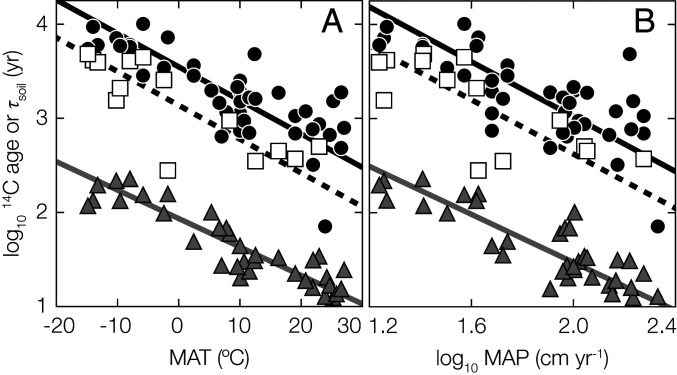
Fig. 4.
Environmental controls on τsoil and biomarker 14C ages. Logarithmic plant-wax fatty-acid 14C ages (black circles), lignin-phenol 14C ages (white squares), and catchment τsoil [gray triangles (5)] as functions of (A) MAT and (B) logarithmic MAP (SI Appendix, Tables S1 and S3). Solid black, dashed black, and gray lines are fatty-acid–, lignin-phenol–, and τsoil-reduced major-axis regression lines. Relationship slopes and r2 values are as follows: (A) fatty-acid 14C ages: slope = −0.036 ± 0.004, r2 = 0.62; lignin-phenol 14C ages: slope = −0.036 ± 0.006, r2 = 0.67; and τsoil: slope = −0.030 ± 0.002, r2 = 0.83. (B) Fatty-acid 14C ages: slope = −1.46 ± 0.17, r2 = 0.55; lignin-phenol 14C ages: slope = −1.44 ± 0.30, r2 = 0.56; and τsoil: slope = −1.13 ± 0.11, r2 = 0.72. Uncertainty (±1σ) is always smaller than marker points.

