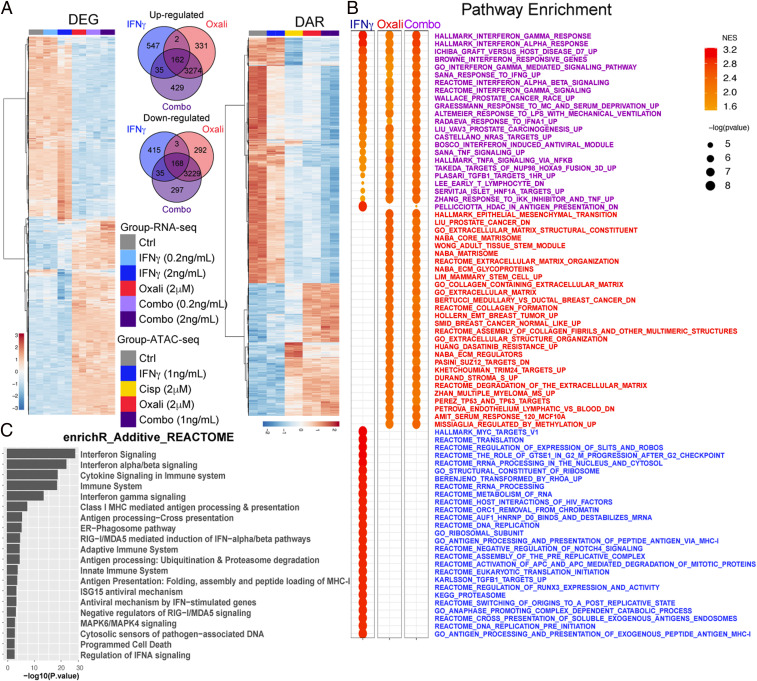
Fig. 1.
Chemotherapy induces MHC-I AgPPM genes. (A) Heatmap showing all DEGs identified in bulk RNA-seq of Myc-CaP cells treated with IFNγ (0.2 or 2 ng/mL), Oxali (2 μM), or both (combo) (Left). Venn diagram shows overlapping DEGs between IFNγ (2 ng/mL), Oxali, and combo treatment groups relative to Ctrl (Middle) and heatmap shows all DARs identified in bulk ATAC-seq of Myc-CaP cells treated as indicated relative to control (Right). (B) Gene set enrichment analysis (GSEA) was applied to expression profiles specific to each treatment group relative to Ctrl. Top 30 significantly enriched pathways for each respective comparison are shown. Some pathways were considered both IFNγ and Oxali driven (purple), while others were specific to either IFNγ (blue) or Oxali (red). (C) Functional enrichment was applied to genes classified with additive response to combination therapy. The top 20 enriched REACTOME pathways are shown.

