Fig. 2.
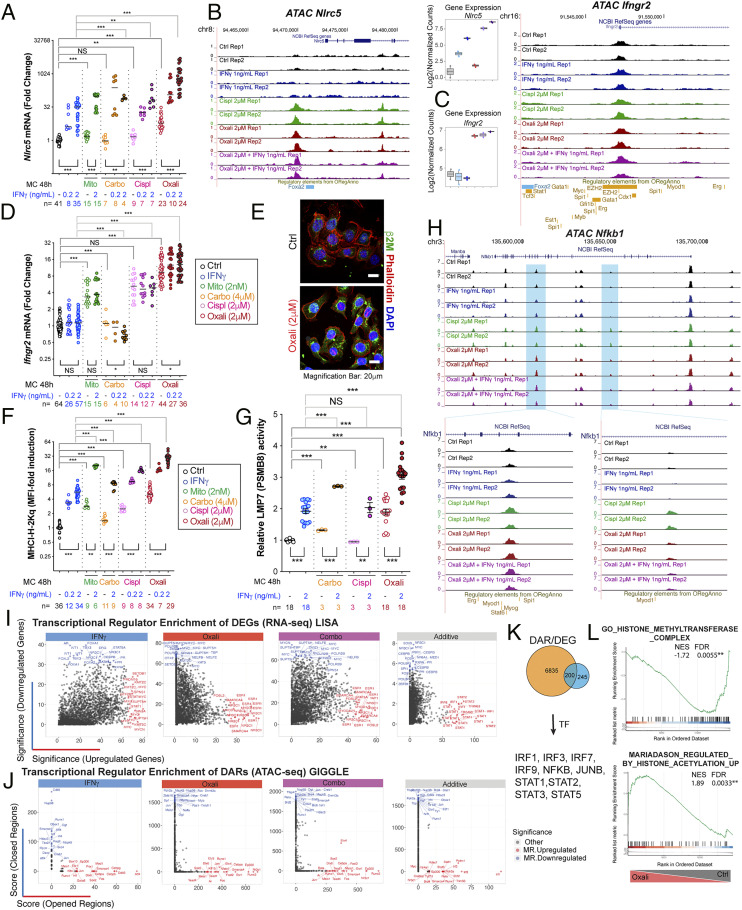
Transcriptional regulators of Oxali-induced MHC-I AgPPM genes. (A) RNAs from Myc-CaP cells incubated as indicated with IFNγ, Mito, Oxali, carboplatin (Carbo), or Cispl for 48 h were analyzed by qRT-PCR using Nlrc5 primers. (B and C) Candidate genomic loci for Nlrc5 (B) and Ifngr2 (C), showing library-size normalized read pair pileup profiles determined by ATAC-seq across samples. Expression of respective genes determined by RNA-seq is also shown. (D) RNAs from Myc-CaP cells incubated as indicated were analyzed by qRT-PCR using Ifngr2 primers. (E) Myc-CaP cells incubated with Oxali for 12 h were stained with β2M antibody (green) and phalloidin (red) and counterstained with DAPI. (Scale bar: 20 μm.) (F) Myc-CaP cells treated as indicated were analyzed for surface MHC-I (H-2Kq) expression by flow cytometry. (G) Myc-CaP cells were incubated as indicated and lysed. LMP7 (PSMB8) immunoproteasome activity was measured using a fluorogenic LMP7-specific substrate peptide Ac-ANW-AMC. (H) Candidate genomic locus for Nfkb1 showing read density profiles determined by ATAC-seq across samples. (I) LISA was applied to DEGs identified in comparisons of IFNγ, Oxali, and both (combo)-treated cells relative to control, as well as to genes classified with additive response (top 500 up-regulated, down-regulated DEGs). The top 20 enriched regulators of up-regulated (red) and down-regulated (blue) DEGs are noted. (J) GIGGLE applied to DARs identified in comparisons of IFNγ-, Oxali-, and combo-treated cells relative to control, as well as to regions classified with additive response. The top 20 enriched regulators of opened (red) and closed (blue) DARs are noted. (K) Two hundred common genes were identified by comparing TFs found by DEG and DAR analysis. (L) Gene set enrichment analysis (GSEA) was applied to expression profiles determined in Oxali-treated cells relative to control. The literature-curated known regulatory elements from ORegAnno database are shown. Candidate enrichment plots for representative pathways related to histone methylation (Top) and acetylation (Bottom) are shown. Two-sided t test (means ± SEM), and Mann–Whitney test (median) were used to determine significance between two groups. One-way ANOVA analysis (A, D, F, G) and multiple comparison confirmed the results. *P < 0.05; **P < 0.01; ***P < 0.001; NS, not significant. Specific n values are shown in A, D, F, and G, each experiment includes at least three biological replicates.

