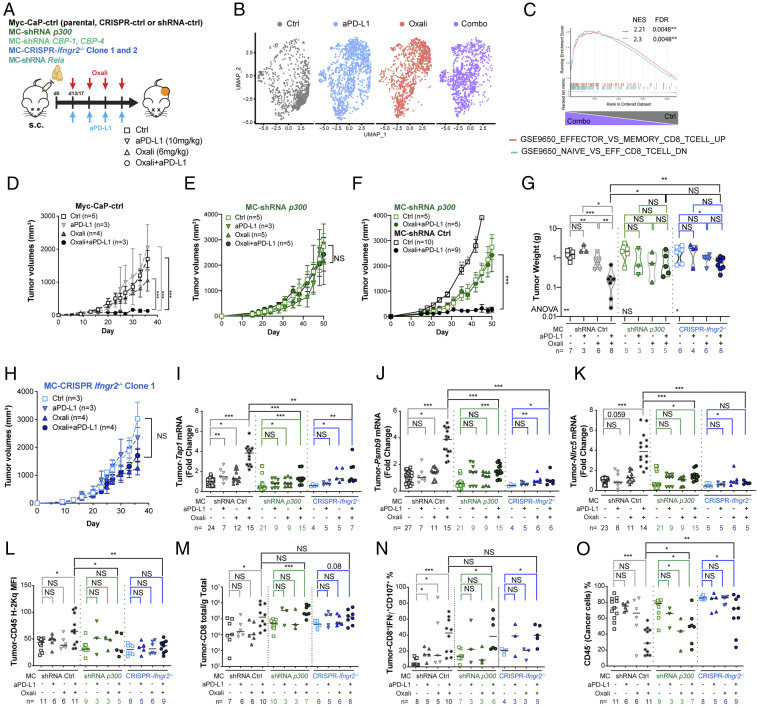
Fig. 7.
Oxali + anti–PD-L1 synergy depends on p300/CBP and IFNγR2 expression. (A) Schematic description of in vivo experiments. Mice bearing s.c. Myc-CaP tumors were allocated into four treatment groups: 1) control, 2) Oxali (6 mg/kg; weekly), 3) anti-PD-L1 (10 mg/kg; weekly), and 4) Oxali + anti–PD-L1 (weekly). After four treatment cycles, during which tumor size was measured, the mice were killed and analyzed. (B) Uniform manifold approximation and projection (UMAP) representation of total T-cell populations profiled by scRNA-seq. Eleven distinct clusters were identified (SI Appendix, Fig. S14 B and C). Proportional contributions of each cluster to sample-specific T-cell populations is shown. Total cell numbers in each cluster are noted in SI Appendix, Fig. S14D. (C) Enrichment plots for candidate pathways defining CD8+ Teff over Tmem and Tnaïve cells. Enrichment plots for the comparison between control and combo treatment is shown (other comparisons are shown in S14H). (D, F, and H) Mice bearing s.c. Myc-CaP tumors generated by control (D), p300-silenced (E and F), and Ifngr2 ablated (clone 1) (H) cells were treated as described in A. Specific n values are shown in each panel. Transient Cas9 expression and stable shRNA transfectants were used to avoid immune responses. Each dot is a treatment group, mean ± SEM. (G) Tumor weights for the indicated experimental groups (n = 3 to 8). (D and H) Two-sided t test (means ± SEM) and two-way ANOVA were used to determine significance. (I–K) Total tumor RNA was analyzed by qRT-PCR for expression of the indicated genes. (L–N) Single-cell tumor suspensions were analyzed for H-2Kq (L) expression on CD45− cells, total number of TI-CD8+ (M) and effector CD8+IFNγ+CD107+ T-cell subsets (N). (O) Solid tumor composition (% cancer cells) was determined by gating on CD45− cells. (G and I–O) Each dot represents a mouse. Mann–Whitney test (median) was used to determine significance. One-way ANOVA and multiple comparisons were used to confirm significance. Specific n values are shown in D–O.

