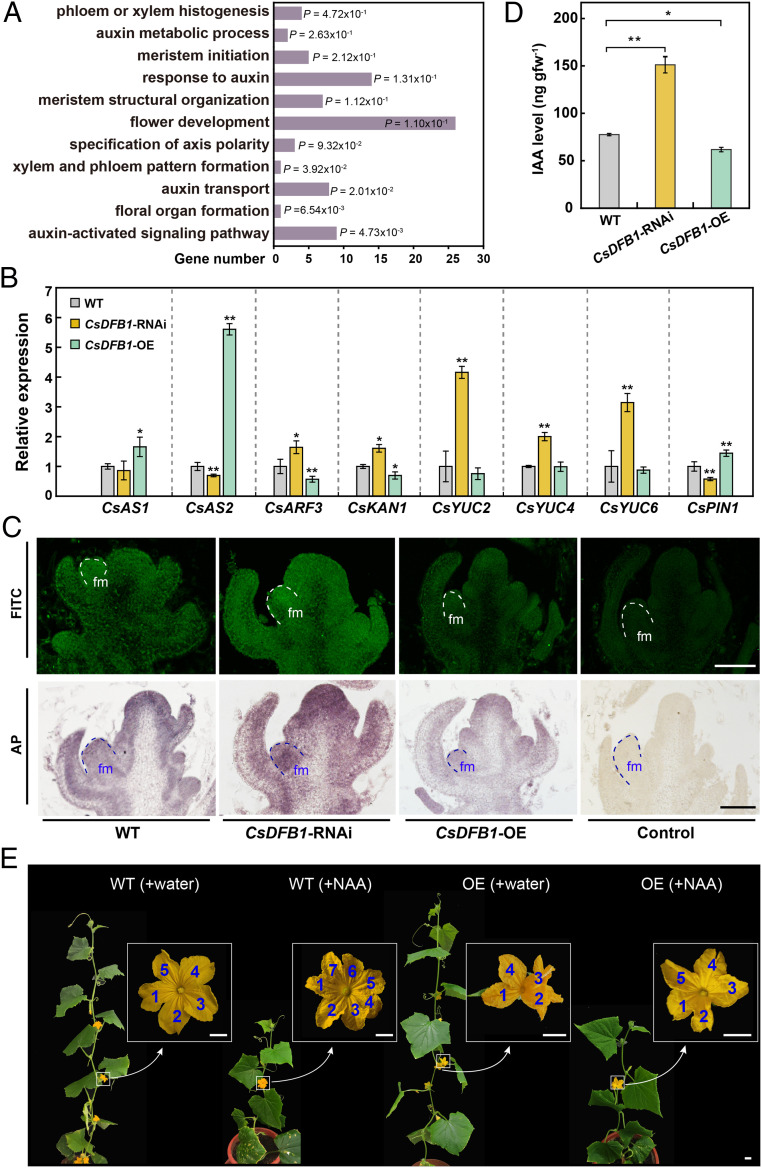
Fig. 3.
CsDFB1 transgenic plants have disrupted auxin distribution. (A) Significantly enriched GO pathways in CsDFB1-RNAi plants based on RNA-seq analysis. (B) RT-qPCR analysis of genes related to polarity or meristem development (e.g., CsAS1, CsAS2, CsARF3, and CsKAN1), auxin biosynthesis (e.g., CsYUC2/4/6), and auxin transport (e.g., CsPIN1) in shoot tips of CsDFB1 transgenic plants and WT plants. Error bars indicate SD of three biological replicates from different plants. Gene IDs: ASYMMETRIC LEAVES1 (CsAS1), Csa3G264750; ASYMMETRIC LEAVES2 (CsAS2), Csa2G070920; AUXIN RESPONSE FACTOR3 (CsARF3), Csa6G518210; KANADI1 (CsKAN1), Csa3G194380; YUCCA2 (CsYUC2), Csa1G242600; YUCCA4 (CsYUC4), Csa2G379350; YUCCA6 (CsYUC6), Csa2G375750; and PIN-FORMED1 (CsPIN1), Csa4G430820. (C) Immunolocalization of IAA in shoot tips of CsDFB1 transgenic plants and WT plants using fluorescein isothiocyanate (FITC)-conjugated (Upper) and alkaline phosphatase (AP)-conjugated secondary antibody (Lower). Green fluorescence and purple staining indicate the signals. (Scale bar, 200 μm.) (D) IAA level in the shoot tips of CsDFB1 transgenic plants and WT plants. Error bars indicate SD of three biological replicates from different plants. (E) Representative photograph of CsDFB1-OE plants and WT plants with or without treatment with 50 μM NAA. Blue numbers inside white boxes indicate the number of petals. (Scale bar, 1 cm.) Significance analysis was conducted with the two-tailed Student’s t test (**P < 0.01; *P < 0.05). Abbreviations: gfw−1, per gram fresh weight; fm, floral meristem; and NAA, 1-naphthylacetic acid.

