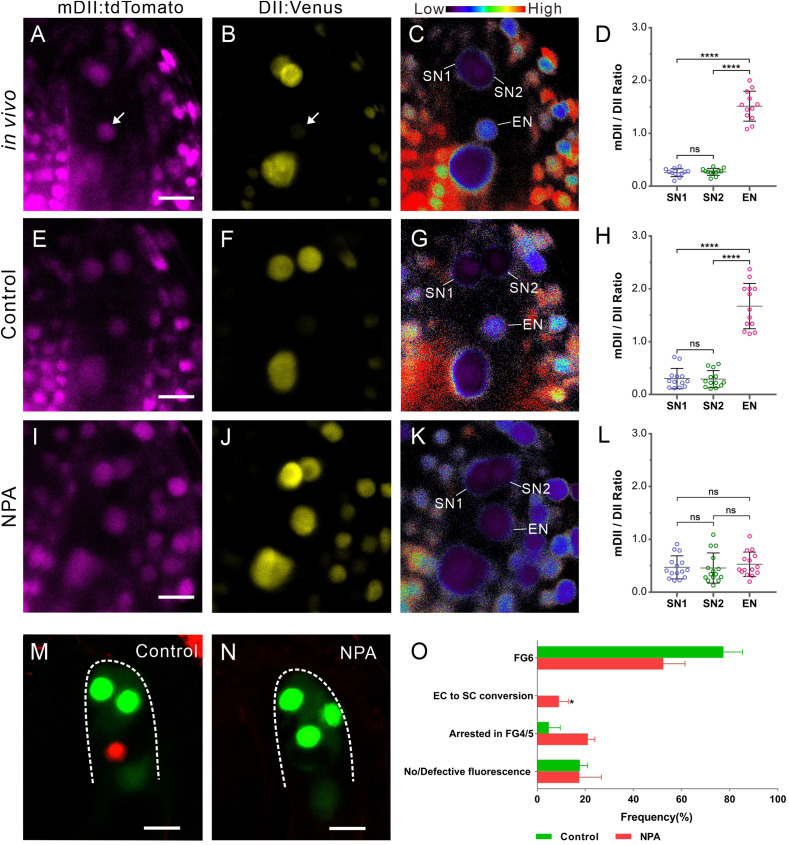
Fig. 4.
Auxin affects cell specialization of the egg apparatus. (A and B) In vivo R2D2 signal at the micropylar end of FG at FG6 stage. R2D2 comprises two components: an auxin-sensitive domain (DII:Venus) and a mutant version of DII (mDII:tdTomato), which serves as a control. A reduction in the DII:Venus signal indicates auxin accumulation. (A) mDII:tdTomato signal. (B) A reduction in the DII:Venus signal at the egg cell nucleus indicates auxin accumulation. Arrows in A and B indicate the egg cell nucleus. (C) Ratio of mDII:tdTomato/DII:Venus signal in A and B. The ratio is displayed as false coloring according to the scale at the top, reflecting low to high auxin levels. The egg cell nucleus (EN) shows a higher auxin level than the two synergid cell nuclei (SN1 and SN2). (Scale bar: 10 µm in A–C.) (D) R2D2 ratio statistics of the egg cell nucleus and synergid cell nucleus (n = 12 ovules). (E–H) In culture ovules without NPA treatment (controls), the R2D2 signal in the egg apparatus (E and F) is similar to that in vivo. The ratios of nuclei show a higher auxin level in EN than in SN1 and SN2 (G and H). (I–L) NPA treatment decreases the auxin level in the egg cell. Following NPA treatment, the mDII:tdTomato signal is similar to that in control (I), while no distinct reduction of the DII:Venus signal is detected in EN (J). The ratio of nuclei shows similar auxin levels among SN1, SN2, and EN (K and L). The R2D2 ratios were calculated from nuclei located in the egg apparatus, n = 13 and 15 ovules for the control and NPA treatment, respectively. The data in D, H, and L are mean ± SD. Significant differences (****P < 0.0001) and nonsignificant differences (ns, P > 0.05) were determined using the paired t test. (Scale bar: 10 µm.) (M and N) The NPCI marker shows cell specialization after treatment with the mock control and 200 µM NPA. (M) In the mock control, there are two synergid cells with GFP fluorescence and one egg cell with RFP fluorescence. (N) After treatment with 200 µM NPA, FGs cannot express the egg cell marker at stage FG6. Three cells express synergid GFP fluorescence. (Scale bar: 10 µm.) (O) NPA treatment affects FG development and egg cell specialization. Ovules treated with 200 µM NPA had enclosed FG at FG4-1. At least three biological replicates were performed for each treatment containing 16 to 23 ovules. The total number of ovules observed was 86 for control and 109 for NPA treatment. We found that 52.4 ± 9.0% FGs could develop to FG6, 9.0 ± 3.9% FGs contained three synergid cells but no egg cell (EC to SC conversion), and 38.6 ± 7.9% FGs arrested in FG4 or FG5 (FG4/5) or lost fluorescence. The data are mean ± SD. Significant differences (*P < 0.05) were determined using the paired t test.

