Fig. 1.
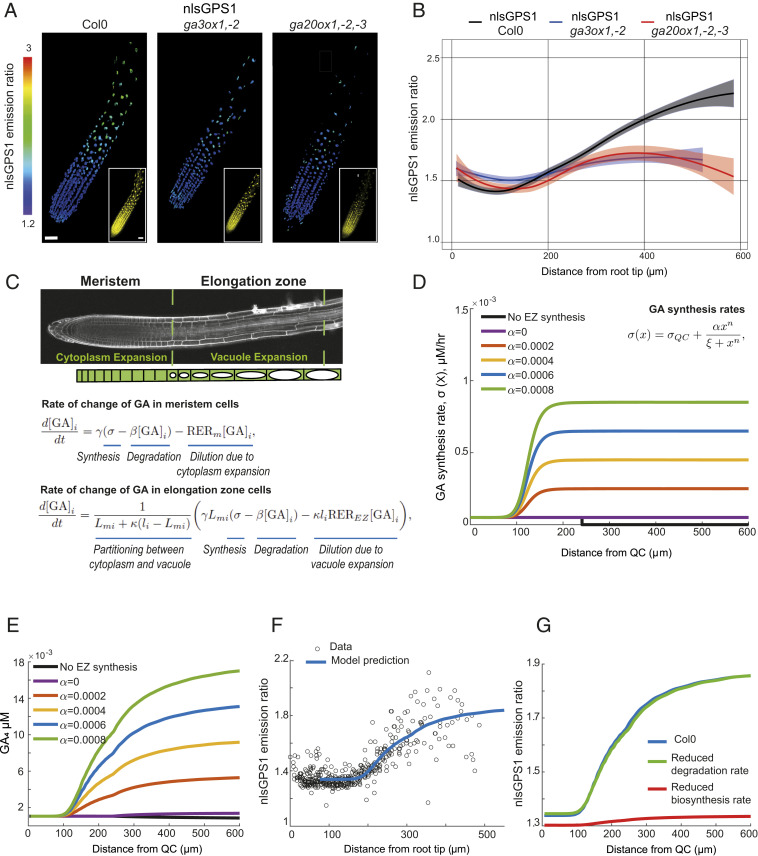
GA biosynthesis in Arabidopsis roots. (A and B) nlsGPS1 emission ratios of roots 4 d post sowing in WT Col0 or GA biosynthetic mutants ga3ox1, ga3ox2 and ga20ox1, ga20ox2, ga20ox3. (A) Representative three-dimensional (3D) ratio and YFP (Inset) fluorescence images (scale bar, 30 µm). (B) Emission ratios as a function of distance from root tip. Curves of best fit and 95% CIs are computed in R using local polynomial regression (Loess) via ggplot, with smoothing parameter span = 0.75. Complete experiments were repeated at least three times with similar results (n = 10 to 30 roots). (C) Schematic of the multicellular mathematical model. The model simulates the GA and nlsGPS1 dynamics in a single cell file that represents cell files within the growth zones of the Arabidopsis root tip. We prescribe the cells’ growth and division dynamics (SI Appendix, Fig. S2): cells divide within the meristem and elongate slowly due to cytoplasmic expansion before ceasing division on entering the elongation zone, where they undergo rapid elongation because of vacuolar expansion. We simulated a system of ordinary differential equations for the cytoplasmic GA concentration in each cell, i, (denoted by [GA]i (t), in terms of time (t)). As shown, the GA dynamics depend on the GA synthesis rate, (σ[x], in which x denotes the distance from the QC), the GA degradation rate, β, the relative elongation rate in the meristem, RERm, the relative elongation rate in the elongation zone, REREZ, the proportion of the meristem cells that is cytoplasm, γ, the ratio between vacuolar and cytoplasmic GA concentrations, κ, the cell length, li(t), and the length of the cell on leaving the meristem (Lmi). We consider GA synthesis rates of the form σ(x)=σQC+αxn/(ξn+xn), as shown in D for n = 10, σQC = 0.00005 and ξ = 125. (D) GA synthesis rate distribution for different values of α. EZ, elongation zone. (E) Prediction of GA distribution with different α values (corresponding to the synthesis rate distributions shown in D). (F) Model prediction with a high GA biosynthesis rate in the elongation zone (α = 0.0006) reproduces the distribution observed in the nlsGPS1 data. Model parameter values are given in SI Appendix, Table S1. (G) Model predictions of nlsGPS1 emission ratios in WT Col0 versus reduced degradation mutant, ga2ox q, and reduced synthesis mutant, ga20ox1, ga20ox2, ga20ox3.

