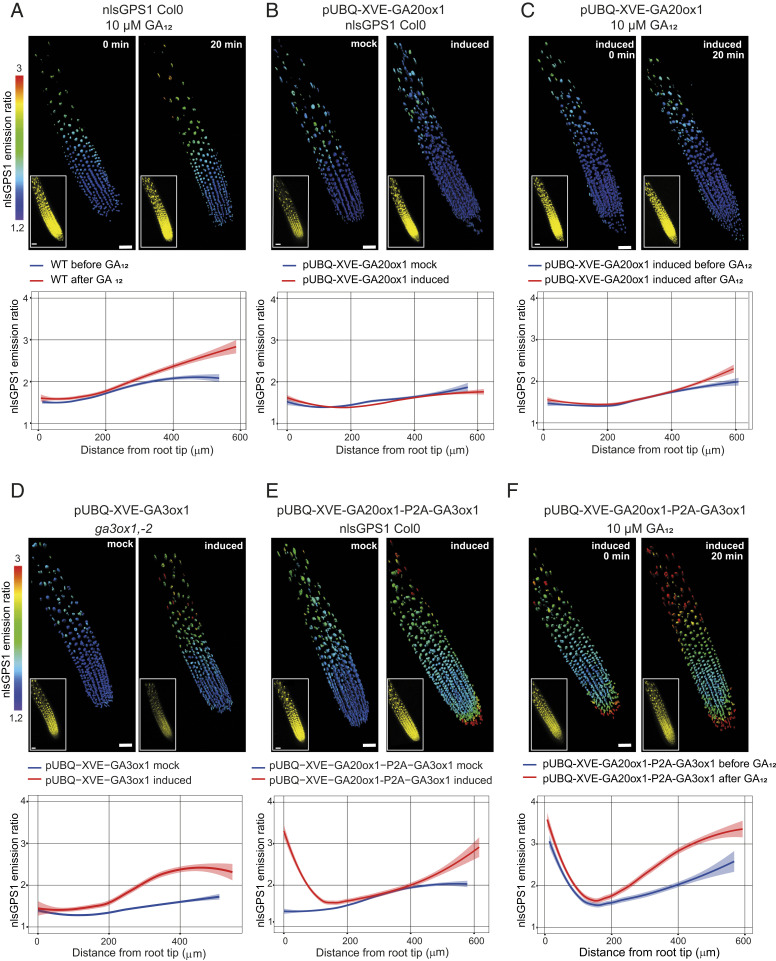
Fig. 2.
Mapping GA biosynthetic enzyme activities in Arabidopsis roots. (A–F) nlsGPS1 emission ratios of roots 5 d post sowing. Shown are representative 3D images of emission ratios and YFP fluorescence (Inset) and the emission ratios as a function of distance from root tip (scale bar, 30 µm). Curves of best fit and 95% CIs are computed in R using local polynomial regression (Loess) via ggplot, with smoothing parameter span = 0.75. Complete experiments were repeated at least three times with similar results (n = 15 to 36 roots). (A, C, and F) Before (0 min) and 20 min after 10 µM GA12. (B–F) β-estradiol inducible GA enzyme transgenic lines 24 h after induction with 5 µM 17-β-estradiol (induced) or with 0.2% DMSO mock induction (mock).

