Fig. 3.
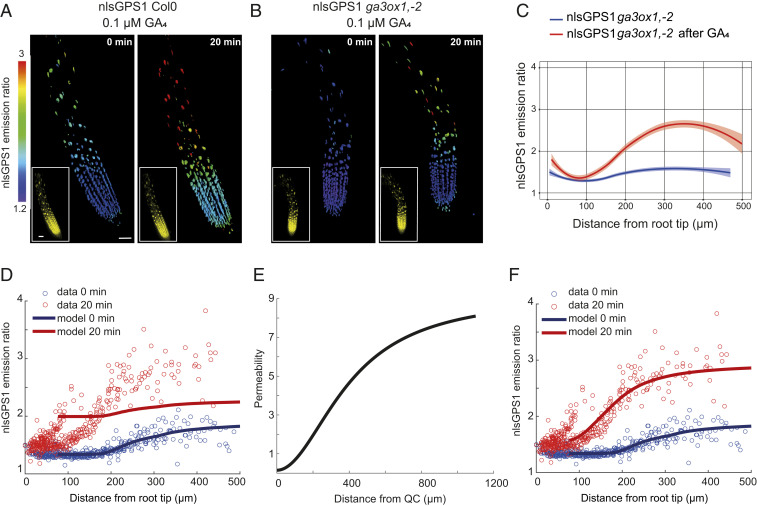
Patterned cellular permeability explains the exogenous GA–generated gradient in Arabidopsis roots. (A and B) Representative 3D images of nlsGPS1 emission ratios and YFP fluorescence (Inset) of WT Col0 and ga3ox1, ga3ox2 roots 4 d post sowing before and 20 min after 0.1 µM GA4 (scale bar, 30 µm). (C) nlsGPS1 emission ratios for nuclei of ga3ox1, ga3ox2 double mutant as a function of distance from the root tip before and after GA4. Curves of best fit and 95% CIs are computed in R using local polynomial regression (Loess) via ggplot, with smoothing parameter span = 0.75. Complete experiments were repeated at least three times with similar result (n = 10 roots). (D) Model prediction and experimental data for the nlsGPS1 distribution after a 0.1 µM GA4 dose assuming spatially homogeneous permeability. (E) Spatially varying permeability specified in model predictions shown in F. (F) Model prediction and experimental data for the nlsGPS1 distribution after a 0.1 µM GA4 dose, assuming a spatially varying permeability as shown in E. Model parameters for D and F are given in SI Appendix, Table S1.

