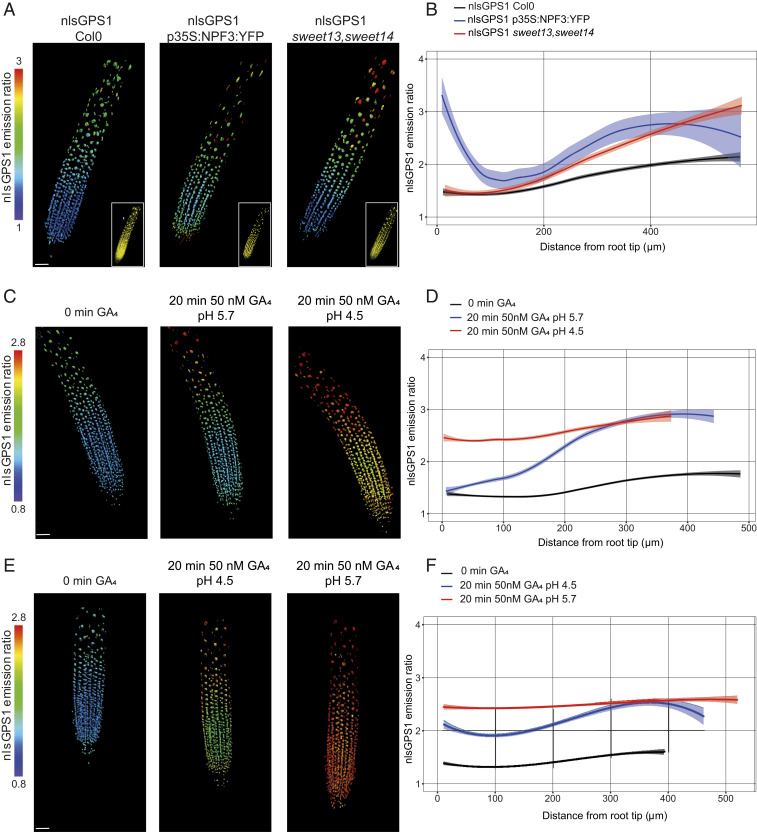
Fig. 4.
Endogenous GA levels in transporter mutants and exogenous GA accumulation under low pH. (A, C, and E) Representative 3D images of nlsGPS1 emission ratios and YFP fluorescence (A only, Inset). (Scale bar, 30 µm.) (B, D, and F) Emission ratios as a function of distance from root tip. Curves of best fit and 95% CIs are computed in R using local polynomial regression (Loess) via ggplot, with smoothing parameter span = 0.75. Complete experiments were repeated at least three times with similar results (n = 15 to 36 roots). (A and B) nlsGPS1 emission ratios of roots 4 d post sowing in WT Col0, p35S:NPF3:YFP, and sweet13, sweet14 double mutant. (C–F) nlsGPS1 emission ratios of seedlings grown in the RootChip8S. (C) Still frames from Movie S1 at 0, 20 min post-GA at pH 5.7, and 20 min post-GA at low pH 4.5. (E) Still frames from Movie S2 at 0, 20 min post-GA at low pH 4.5, and 20 min post-GA at pH 5.7.

