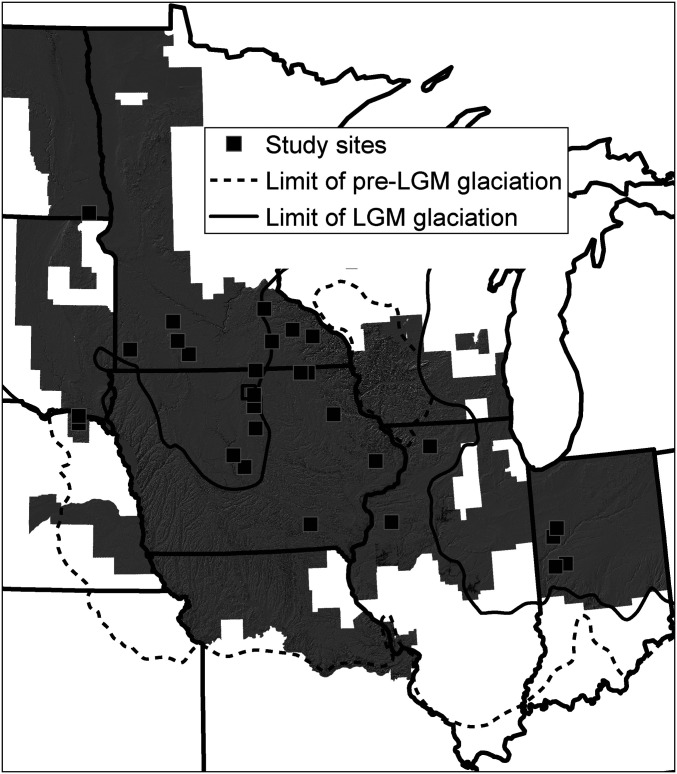
Fig. 1.
Study area in the midwestern United States. The study area is defined by the spatial extent of LiDAR topographic data (gray hillshade). The squares show the locations of 28 sites where 210 km2 of imagery from plowed agricultural fields with bare soil was analyzed. The open square indicates the location of the field shown in Fig. 2. The glacial extent prior to the last glacial maximum (LGM) and the extent during the LGM are shown as dashed and solid lines, respectively.

