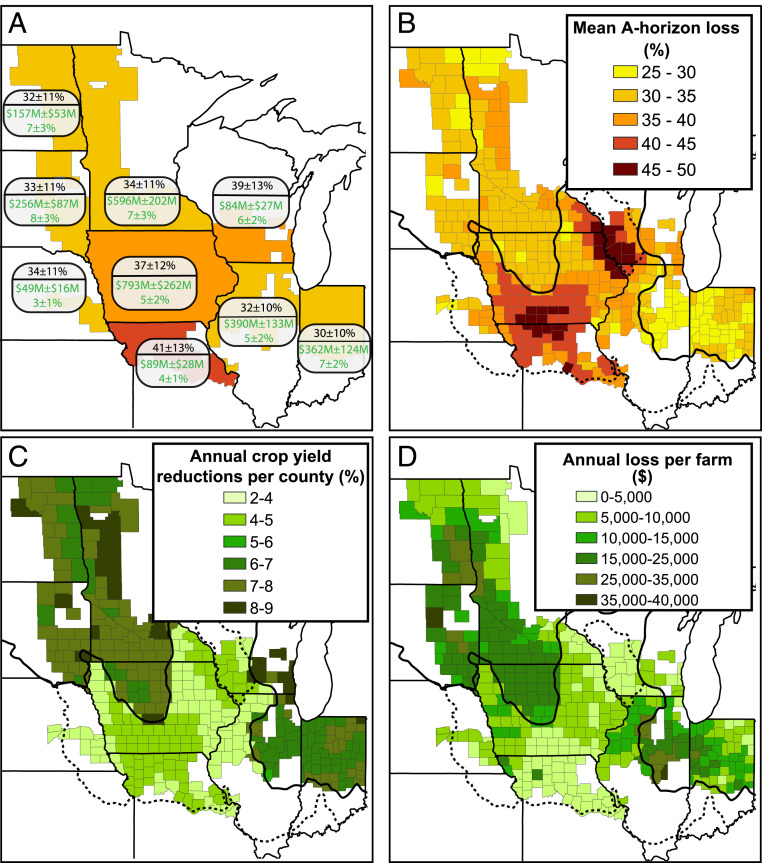
Fig. 4.
A-horizon loss and associated economic losses within the Corn Belt. (A) Aggregated percent A-horizon loss (black text) and annual economic losses expressed in millions of dollars (M) and as a percentage relative to uneroded soils (green text) for each state within the region (color scale is the same as in B). (B) Percentage of A-horizon loss for each county. (C) Percent annual economic losses for each county relative to predictions for uneroded soils. (D) Predicted mean annual economic losses per farm in each county. The LGM and pre-LGM glacial extent, which define the distribution of glacial till- and loess-derived soils, are shown as solid and dashed lines, respectively.

