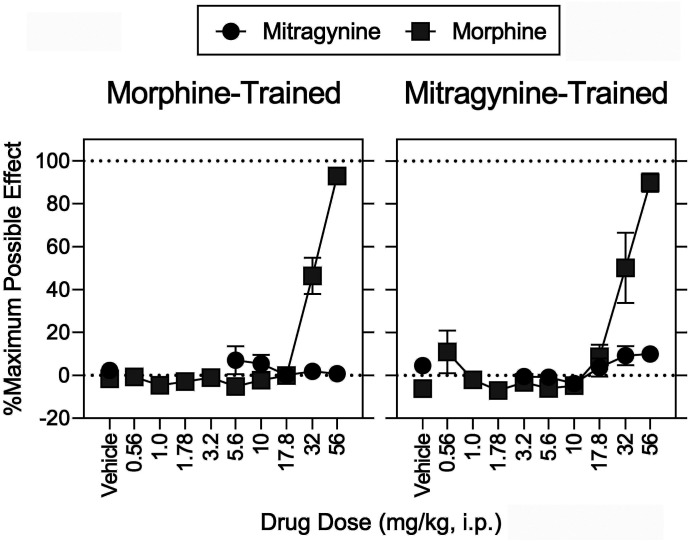
Fig. 4.
Antinociceptive effects determined in conjunction with the discrimination tests shown in Fig. 5. Abscissae: vehicle and drug dose in mg/kg (intraperitoneal, log scale) in separate groups of rats discriminating either morphine (left) or mitragynine (right). Ordinates: percentage of maximum possible antinociceptive effects. Each point represents the mean ± S.E.M. (N = 8). Morphine and mitragynine were administered intraperitoneally, respectively, at 15 and 30 minutes before sessions. Details for statistical analyses are shown in Supplemental Tables 2–4 and Tables 5 and 6.

