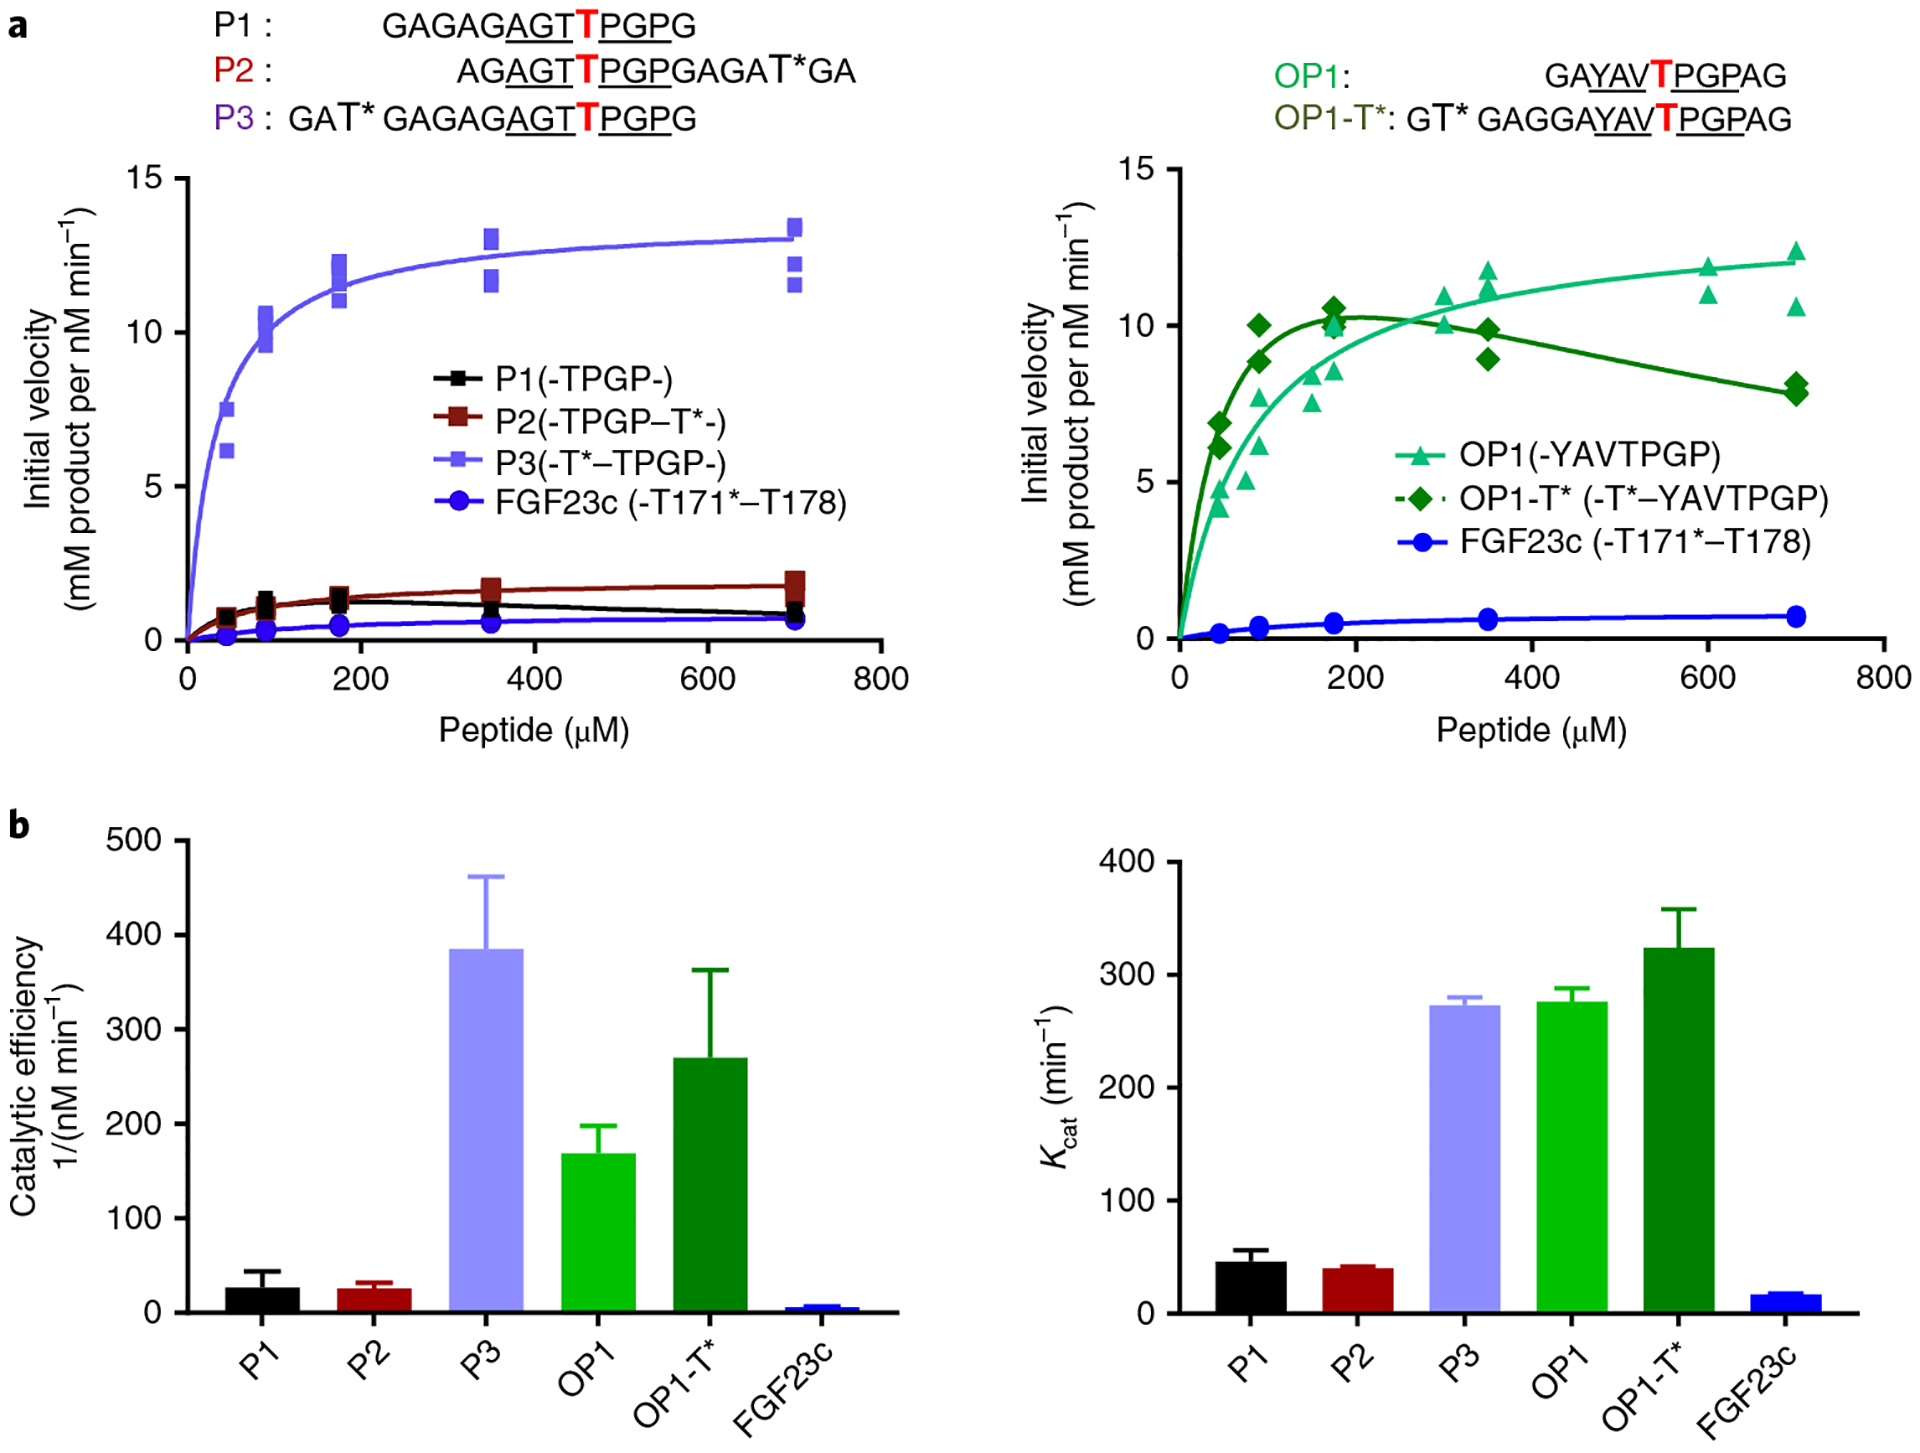
Fig. 3 |. Glycosylation kinetics of human GalNAc-T3 against a series of (glyco)peptides.

a, Glycosylation kinetics of GalNAc-T3 against the N-terminal prior glycosylated FGF23c (T*171–T178) glycopeptide in comparison to P1, P2, P3 (left) and OP1 and OP1-T* (right). Plotted lines represent the Michaelis–Menten nonlinear fit (using GraphPad Prism 7.03) of the initial velocity data using the kinetic values given in Supplementary Table 2. Initial velocities (individual points) were obtained in triplicate or higher for each peptide concentration (except for OP1-T*), giving a total of 19, 16, 16, 21, 21, 13 and 24 independent determinations for P1, P2, P3, OP1, OP1-T* and FGF23c, respectively. b, Summary of Kcat and catalytic efficiency values derived from the GraphPad Prism fit of the data in a (see Supplementary Table 2). Error bars represent the standard deviation calculated by the GraphPad Prism fit of the data sets as described in the Methods. Note that the fitting of OP1-T* included substrate inhibition.
