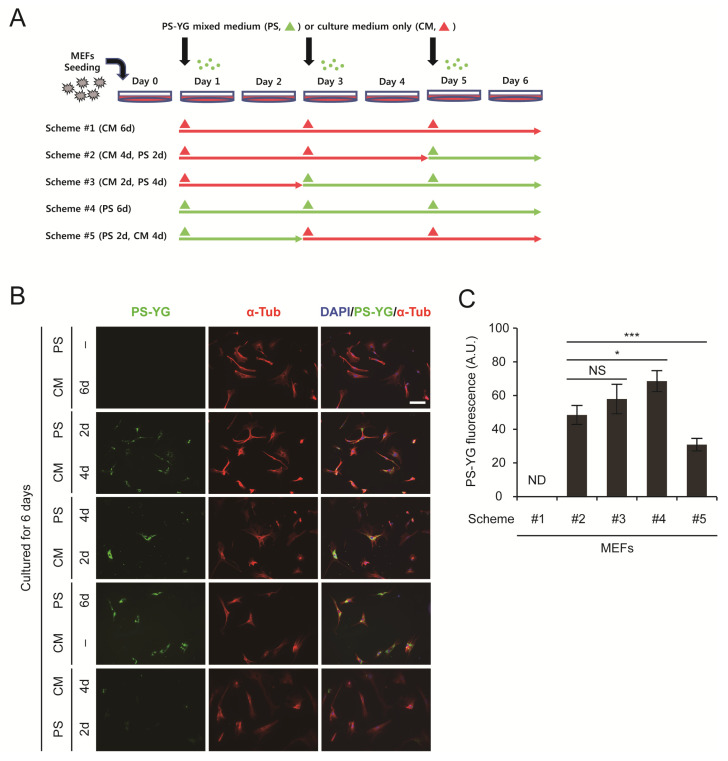
Figure 4.
Clearance of PS nanoplastics from the cytoplasm of MEFs. (A) Schematic representation of experiments. (B) MEFs were treated with 100 nm PS-YG nanoplastics at 200 mg/L for 2 to 6 days. Cells were subjected to immunofluorescence analysis using an anti-α-tubulin (α-Tub) antibody and DNA was visualized with DAPI. Direct fluorescence from PS-YG nanoplastics was also visualized. (C) Quantitative analysis of PS-YG fluorescence levels in (B). Green fluorescence levels in all α-Tub-positive cells in the field were determined and expressed as the means ± SEM from the number of cells shown. PS, PS-YG mixed medium. CM, culture medium only. * p < 0.05; *** p < 0.001 between two groups, as indicated by horizontal bars. ND, not determined. NS, not significant. Scale bar, 100 μm.

