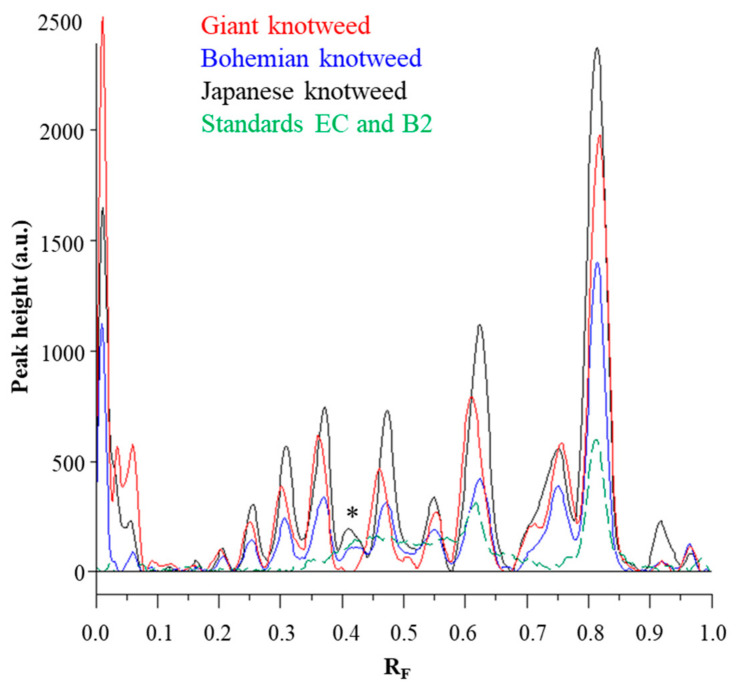
Figure 5.
Comparisons of the videodensitogram of standards (−)-epicatechin (EC; RF = 0.82) and procyanidin B2 (B2; RF = 0.63) (30 ng; dashed green line) with the videodensitograms of the fingerprint profiles of STSs (1 μL, 50 mg/mL) from rhizomes of Japanese (black line), Bohemian (blue line) and giant knotweed (red line). The videodensitograms were obtained in absorption mode by image analysis of the HPTLC silica gel plate after the development with toluene–acetone–formic acid (3:6:1, v/v) and after the derivatization with DMACA detection reagent. The asterisk (*) indicates the peaks that are specific to Japanese and Bohemian knotweed rhizomes.

