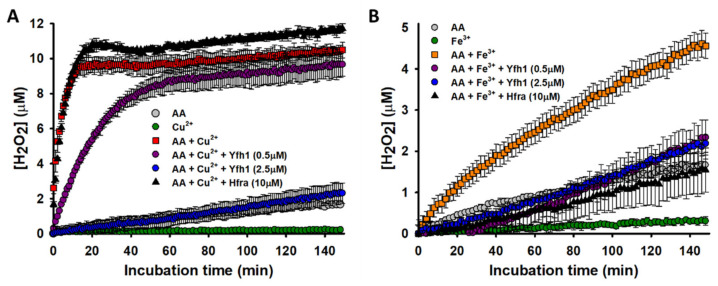
Figure 3.
Effect of Hfra and Yfh1 on the formation of H2O2. (A) Time-dependent formation of H2O2 during the Cu2+-catalyzed oxidation of AA. The concentration of H2O2 was measured by the increase in resorufin fluorescence at 590 nm. The different reaction mixtures contained: (i) Cu2+ (2.5 μM) alone (●); (ii) AA (70 μM) alone (●); (iii) AA (70 μM) and Cu2+ (2.5 μM) (■); (iv) AA (70 μM), Cu2+ (2.5 μM) and Yfh1 (0.5 μM) (●); (v) AA (70 μM), Cu2+ (2.5 μM) and Yfh1 (2.5 μM) (●); and (vi) AA (70 μM), Cu2+ (2.5 μM) and Hfra (10 μM) (▲). (B) Time-dependent formation of H2O2 during the Fe3+-catalyzed oxidation of AA. The reaction mixtures contained: (i) Fe3+ (2.5 μM) alone (●); (ii) AA (70 μM) alone (●); (iii) AA (70 μM) and Fe3+ (2.5 μM) (■); (iv) AA (70 μM), Fe3+ (2.5 μM) and Yfh1 (0.5 μM) (●); (v) AA (70 μM), Fe3+ (2.5 μM) and Yfh1 (2.5 μM) (●); and (vi) AA (70 μM), Cu2+ (2.5 μM) and Hfra (10 μM) (▲). In both panels, the data points are the mean from all experiments, and the error bars represent standard deviation from the different independent measurements.

