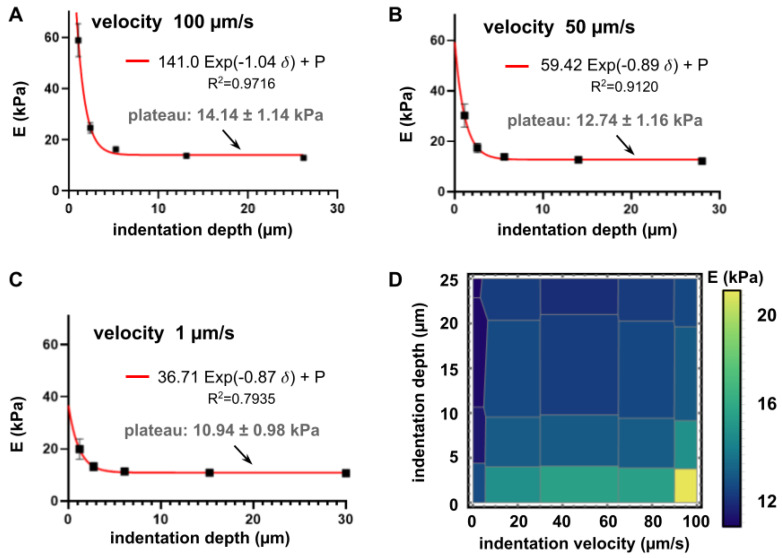
Figure 3.
Influence of velocity and depth of indentation on the computed Young’s modulus of a 4 kPa PAM hydrogel, measured in a detergent solution of ddH2O + 0.1% extran. Panels (A)–(C) present the results for velocities of 1, 50 and 100 µm/s respectively. The values presented correspond to calculations using a Hertz model fitting. By increasing the indentation depth, the fitted modulus decreases down to a plateau level of 14.14 ± 1.14 kPa, 12.74 ± 1.74 kPa and 10.94 ± 0.98 kPa, respectively. It was possible to fit those values to exponential decays as a function of the indentation depth, shown in the legend of each graph. In addition to the velocities shown in panels A–C, velocities of 80 and 10 µm/s were tested and shown in the density diagram of panel (D) This graph is divided into different Voronoi regions (grey mesh) to visually present the influence of velocity and indentation depth. In panels A–C, error bars represent the mean standard deviation and when not visible, they are smaller than the data point visible dimension.

