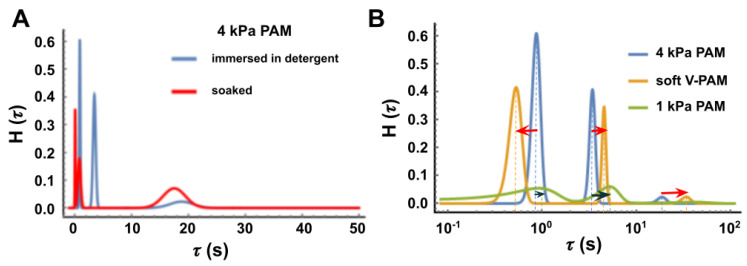
Figure A4.
To report on the experimental variability, we plotted a distribution of characteristic relaxation times (represented by Dirac deltas in Figure 4B of the main text), grouping the results of several measurements of different samples. (A) Comparison between the relaxation spectra of a 4 kPa PAM hydrogel when measured either immersed in detergent solution or soaked but in air. While the material is identical, the experimental conditions differ and a relaxation time appears at 3.43 ± 0.24 s when the sample is immersed in detergent. Also, an additional relaxation peak appears at τ = 0.05 ± 0.05 s in the soaked condition. These differences are probably caused by relaxation effects due to poroelasticity when diffusion happens at different times (see main text). (B) Comparison between the different relaxation spectra of samples measured in detergent solution. Each peak represents a normal distribution centered in τi with a standard deviation σ, obtained by gathering values of τi from 2 independent samples for each condition (n = 11). Note: A normal distribution was supposed, with the standard deviation of the data being the deviation of the distribution and the weight is represented by . Because the distributions are gaussian distributions, a smaller peak represents a greater standard deviation, hence a greater dispersion (variability) of the data.

