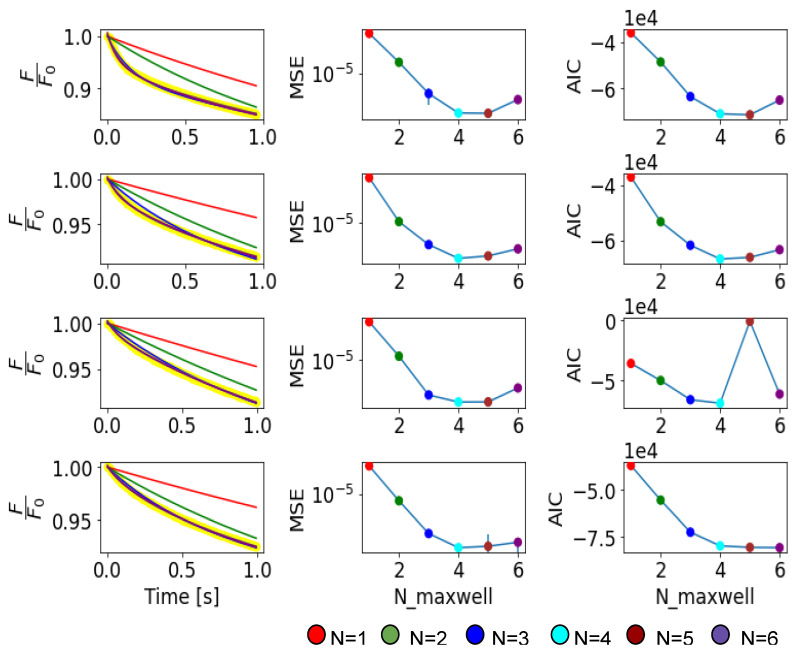
Figure A7.
Example of the method of determination of best GMM fitting order for stiff PAM hydrogel samples. The left column shows the experimental data of 4 curves (yellow) together with their GMM fittings of different orders (corresponding to a different number of Maxwell elements, or arms). Each dot presented in the graphs at the center and right columns are the MSE criterion (center) and Akaike information criterion (right) for N arms in the GMM fitting, showing which order is the best.

