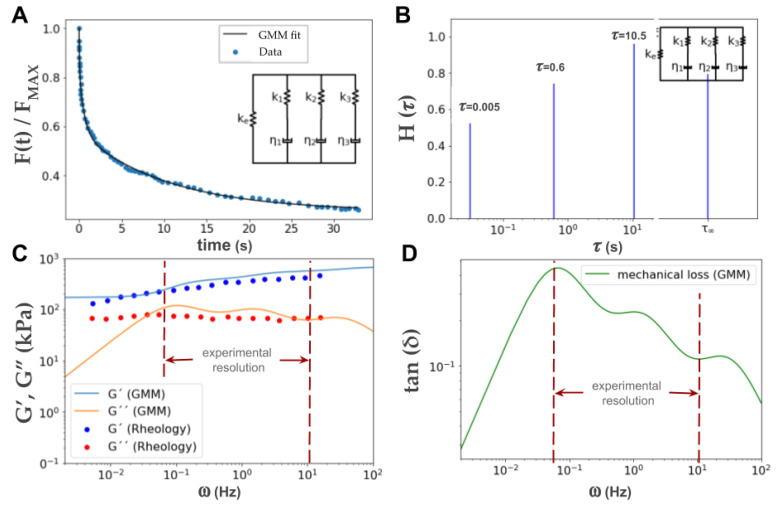
Figure A8.
GMM analysis of published experimental data (FT curve) obtained by nanoindentation-relaxation of a biological cell using AFM [61] and comparison of computed frequency behavior with experimental data of dynamic moduli. The data were recovered manually from the published article. This figure corroborates the usefulness of the proposed method to characterize soft materials used in mechanobiology by only using a simple FT curve with relaxation. The raw stress-relaxation data were collected from Figure 1 of reference [61]: a cell was indented and relaxed using an ARROW-TL1 cantilever with an attached 4.7 μm silica bead, and with a spring constant 0.05 N m−1. (A) Graph reproducing the experimental relaxation data obtained from [61] together with the corresponding GMM 3rd order fit. (B) Relaxation spectra associated with the hydrogel sample. We can observe that the relaxation times are of the same order as the ones found in Figure 4 and Figure A4, of our experiments. (C) Representation of the dynamic moduli G′ and G″ obtained from our GMM model (calculated from E* using the relation in Section 2) and compared with the actual experimental data from rheology [61]. From frequencies of ~10−1s−1, the tendencies are very similar. It is striking that only with the data of the single relaxation curve of panel A the full frequency characterization is possible. Interestingly, in [61] the sample was indented 0.4 µm at a velocity of 30 µm/s; the indentation lasted 0.13 s corresponding to the highest frequency (10 Hz) and the relaxation lasted 30 s (~10−1 Hz). It was obtained that G′(1 Hz) = 432.19 Pa and G″(1 Hz) = 98.75 Pa, values that are recommended to be used to compare the results obtained with other characterization methods. (D) Losses in elastic energy are defined as tan(δ) = G″/G′ and it can be observed that the major loss is at frequencies around 10−1 Hz and longer times (>10 s) dissipate less elastic energy.

