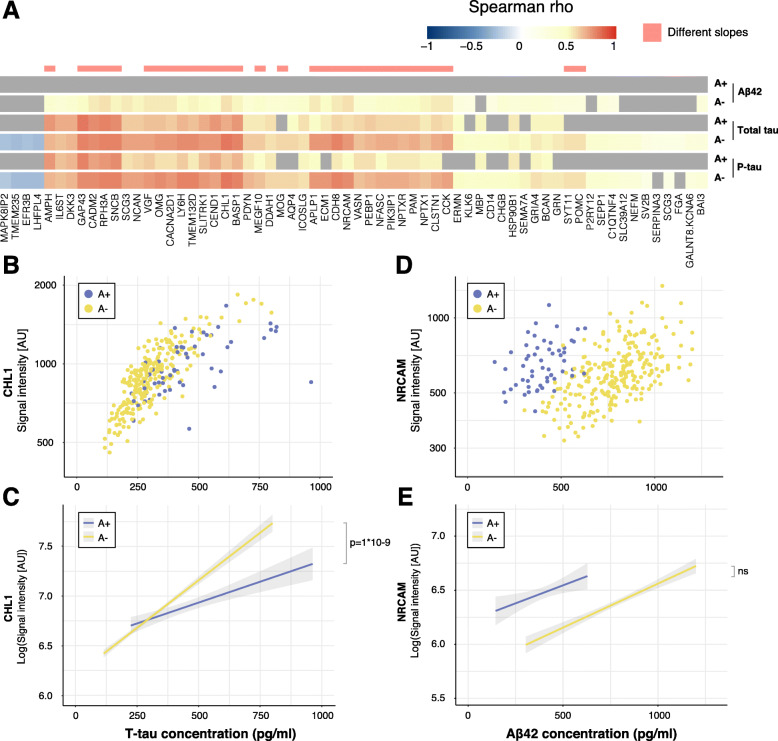
Fig. 2.
Associations with CSF markers for individuals divided by CSF Aβ42/Aβ40 ratio. a Heatmap of all significant correlation coefficients for individuals defined as A+ and A−. Spearman rho values are indicated by the colour key and grey colour represents non-significant correlations. Significant differences in slopes for association to t-tau and p-tau are indicated in pink. b Scatterplot of CHL1 levels and t-tau concentration. Both A+ and A− individuals display significant associations between CHL1 levels and t-tau concentration (A+: Spearman rho = 0.69; p = 5E−07, A−: Spearman rho = 0.80; p = 5E−56). c Linear regression revealed a significant difference between the slopes of CSF A+ and CSF A− individuals for the association between CHL1 and t-tau concentration (t = 7.13; p = 1E−09). d Scatterplot of NRCAM levels and Aβ42 concentration. A− individuals displayed a significant correlation between NRCAM levels and Aβ42 concentration (Spearman rho = 0.56, p = 4E−20) but not A+ individuals (Spearman rho = 0.36, p = 0.8). e Linear regression showed no significant difference between slopes of A+ and A− individuals for the association between NRCAM and Aβ42 concentration

