Fig. 4.
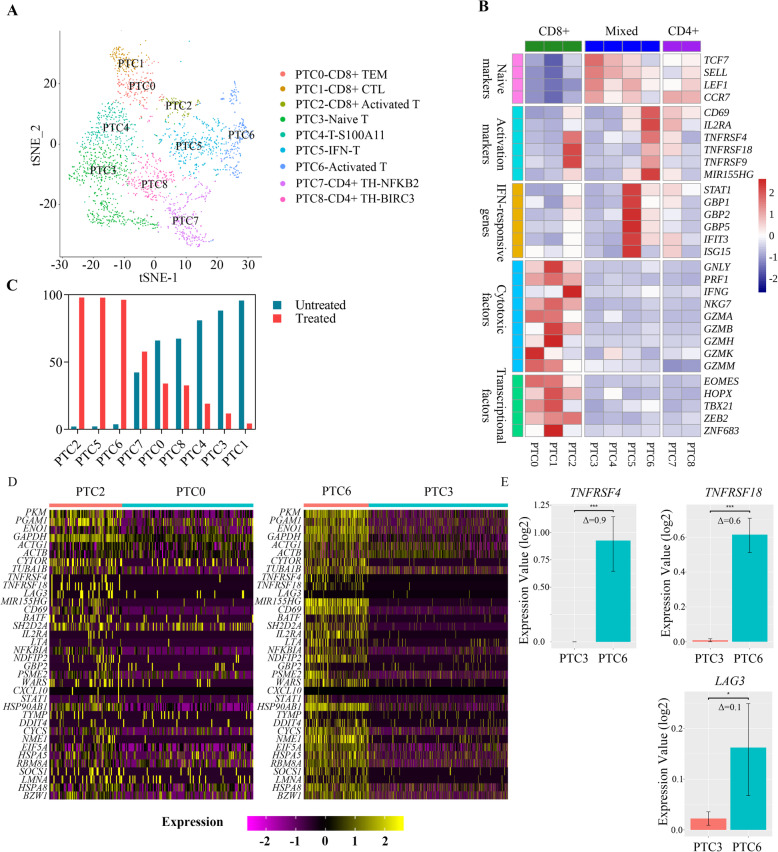
Characterization of T cell subtypes in patient derived B-ALL cytotoxicity model. a A t-SNE projection of all T cells in the patient derived model with 9 subclusters. The identity of each cluster was determined based on its signature genes. b Z-score normalized mean expression of signature genes in each cluster. c The proportion of each cluster in untreated (205BM-B0, 207BM-B0, and 207 L-B0) vs blinatumomab-treated (205BM-B50, 207BM-B50, and 207 L-B50) samples. d Heatmap of the 36 common genes identified in cell line models, differentially expressed between PTC2-CD8+ Activated and PTC0-CD8+ TEM, PTC6-Activated T and PTC3-Naïve T single cells. e Bar plot of the expression of TNFRSF4, TNFRSF18 and LAG3 in clusters PTC3-Naïve T and PTC6-Activated T. The y-axis shows the log2 value of the expression value. Δ represents the log2 value of the fold change

