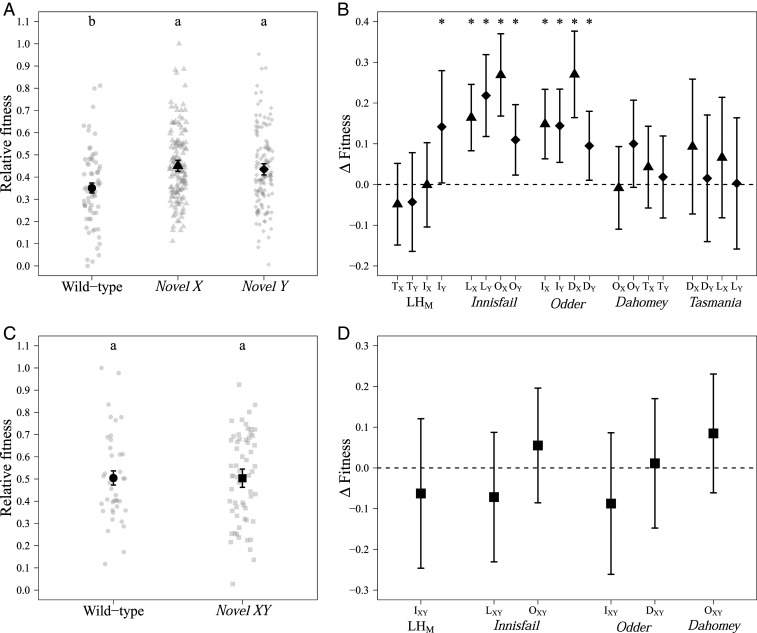
Fig. 2.
Male reproductive fitness assays at generation 0. (A) Relative reproductive fitness for wt (circles), novel X (triangle), and novel Y (diamonds) males. We detected statistically significant (P = 2.45e−04) increases in reproductive fitness for both novel X and novel Y males compared to the wild-type populations (Tukey HSD; P < 0.05). Shown is mean (±SE) of fitted values from the linear model. The raw data are plotted as gray points. (B) Change in relative fitness between the wt and the novel populations. ∆Fitness = ωnovel population − ωwild type with bars indicating bootstrap 95% confidence (Materials and Methods). Ten of 20 novel populations (novel X, triangle; novel Y, diamond) had significantly higher fitness than their wt counterpart (indicate by asterisks), and 16 populations had changed in a positive direction, which was more than expected by chance (P = 0.01). Each of the five wild types is indicated underneath its four novel populations. Uppercase letters indicate which population the novel sex chromosome originates from (D, Dahomey; I, Innisfail; L, LHM; O, Odder; and T, Tasmania) and the novel sex chromosome is denoted by X or Y subscripts. (C) Relative reproductive fitness for wt (circles) and novel XY (squares) treatment groups. There was no significant difference between wt and novel XY. Shown is mean (±SE) of fitted values from the linear model. The raw data are plotted as gray points. (D) Change in relative fitness between the wt and the novel XY population (∆Fitness = ωnovel XY population − ωwild type) with bars indicating bootstrap 95% confidence. Novel XY: squares.

