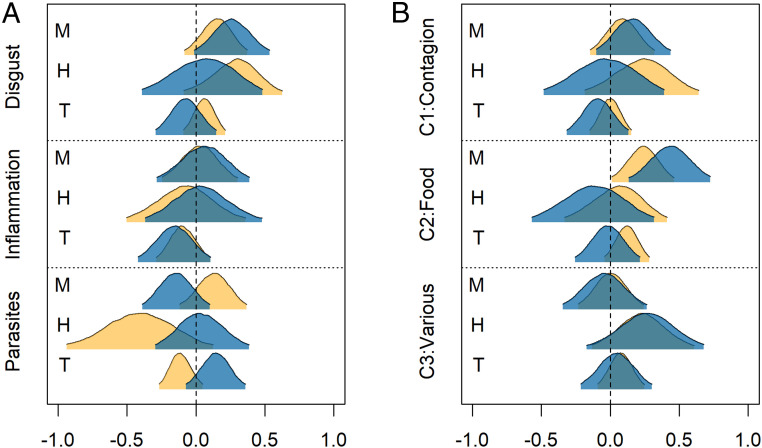
Fig. 4.
Market integration, disgust, and infection. (A) Posterior parameter distributions for effects of market integration on infection and disgust. (B) Effects of market integration on disgust components. Parameters are from full multivariate path models (SI Appendix, Fig. S4 and Tables S7–S9), with each plotted posterior distribution representing the combined distribution from the two models with that pathway. Yellow distributions are effects on households. Blue distributions represent effects at the individual level, controlling for levels of other household members. Shaded area is the 95% highest posterior density interval. The abbreviations M, H, and T represent market-integrated, household, and traditional SOL, respectively.

