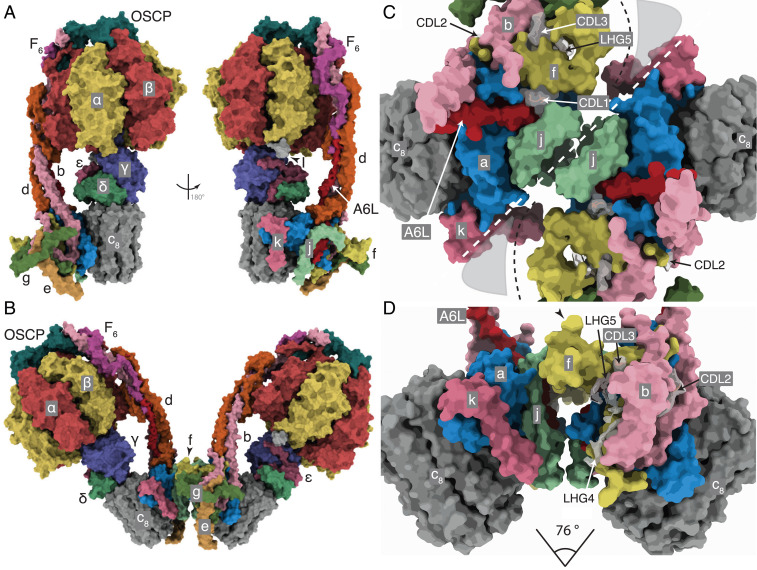
Fig. 1.
The structure of the bovine ATP synthase and the monomer-monomer interfaces in the membrane domains of dimers. (A and B) The structures and subunit compositions of the bovine ATP synthase monomer in rotational state 3 (Protein Data Bank [PDB] ID code 6ZQN (2)) and the dimer in state [s1:s1] (PDB ID code 7AJB), respectively, shown as solvent excluded molecular surfaces. The s1:s1 dimer was created by docking two s1 monomers (PDB ID code 6ZPO) into the lower resolution s1:s1 dimer map. The α, β, γ, δ, and ε subunits of the F1 catalytic domain are red, yellow, blue, indigo, and green, respectively, with the central stalk (subunits γ, δ, and ε) attached to the c8 ring (dark gray) in the membrane domain in contact with subunit a or ATP6 (cornflower blue). The PS subunits OSCP, b, d, and F6 are teal, light pink, orange, and magenta, respectively, and the A6L subunit is brick red. In the region of the monomer-monomer interface, subunits e, f, g, j, and k are khaki, straw yellow, forest green, sea-foam green, and dark pink, respectively. Cardiolipin (CDL) and phosphatidyl-glycerol (LHG) are transparent gray. In A, the monomeric complex is viewed in two rotated positions to reveal the positions of all subunits, with the rotatory axes aligned vertically. I denotes residues 1–60 of the inhibitor protein IF1. In B, the dimer is viewed from within the plane of the IMM. (C and D) The solvent excluded molecular surfaces of subunits in the membrane domains of the dimeric complexes viewed between the two peripheral stalks. (C) The complex is viewed from the matrix side of the IMM with the monomer:monomer interfaces indicated by the white dashed line. The black dashed line denotes the protein boundary between the monomers, adjacent to a region occupied by nonspecific lipids and the detergent micelle (gray shading). (D) The orthologous view in the plane of the IMM with the monomer:monomer interfaces exposed by removal of subunits e, g, and d. The angles between the axis of rotation in each monomer indicated beneath were estimated by calculating two centroids for residues 2 and 38 in each bovine c8 ring. The axis connecting the two centroids approximates to the rotatory axis of the c ring. The centroids and connecting axes were calculated with the Structure Measurements tool-set in Chimera (35). The angle of intersection was measured from the models aligned with these axes orthogonal to the direction of the view.

