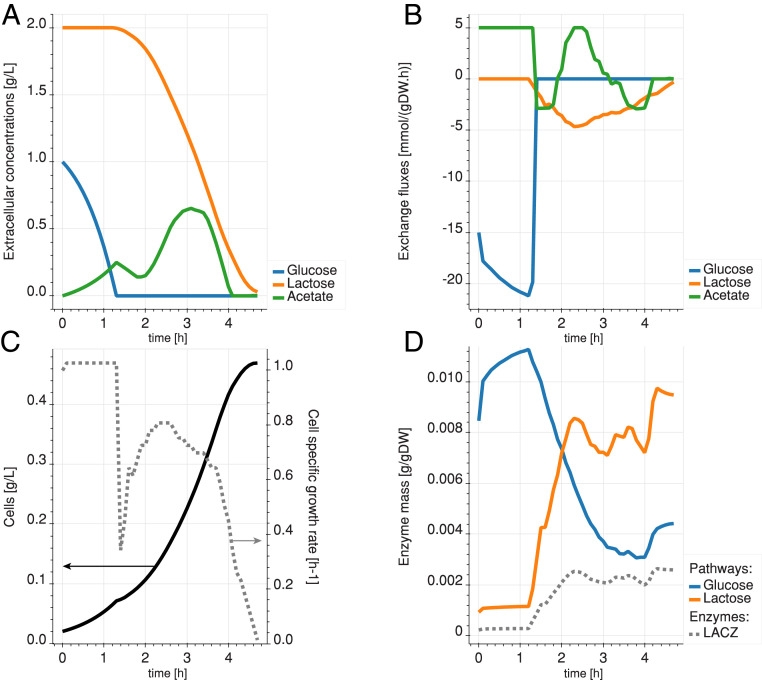
Fig. 4.
Diauxic simulation with glucose-only preculture. (A) Temporal evolution of the extracellular concentrations of glucose (blue), lactose (orange), and acetate (green). (B) Exchange rates of the cell. Positive exchange rates mean production, and negative exchange rates mean consumption. (C) Cell concentration (solid line) and growth rate (dashed line) of the culture over time. (D) Mass of enzymes allocated to the transformation of glucose (blue) and lactose (orange) in G6P. The dashed gray line shows the levels of -galactosidase (LACZ) enzyme (in the Leloir pathway).

