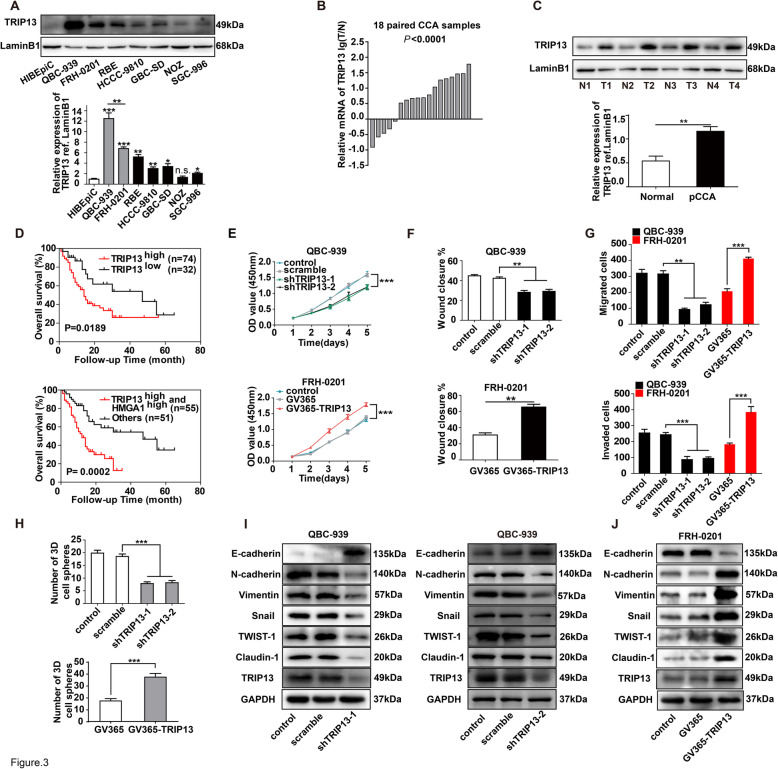
Fig. 3.
TRIP13 was correlated with poor prognosis and progression of pCCA. a TRIP13 expression in biliary cell lines. Up: Expression of TRIP13 in HiBEpiC, iCCA cell lines, pCCA cell lines and gallbladder cancer cells. Bottom: the quantification of the TRIP13 bands in WB. b TRIP13 mRNA levels in 18 pairs of pCCAs and adjacent normal bile duct tissues were detected with qRT-PCR, and showed as log (TRIP13Tumor/TRIP13Non-tumor). c TRIP13 expression was detected in four pairs of pCCA tissues and adjacent normal duct tissues with WB (up), and the bands were quantified (bottom). d The prognostic significance of TRIP13 expression (up), and co-expression of TRIP13 and HMGA1(bottom) were analyzed with survival analysis by log-rank test. e HMGA1 was knocked down in QBC-939 cells and overexpressed in FRH-0201 cells; cell proliferation was detected with CCK8 assays within 4 days of culture. f,g Migration and invasion of QBC-939 and FRH-0201 cells, as detected by wound healing assay (f) or transwell assay(g) after silencing or overexpressing HMGA1. h 7-day sphere formation assays were performed to determine the effects of TRIP13 on stem cell characteristics of pCCA cells. i, j Effect of TRIP13 on the EMT in pCCA cells was evaluated by WB after silencing (i) or overexpressing (j) TRIP13 expression. *, ** and *** represents P < 0.05, P < 0.01 and P < 0.001, compared with the corresponding control group, analyzed with the T-test (c,f-h) or one-way ANOVA (e). Data were from three independent experiments and shown as means ± S.E.M.

