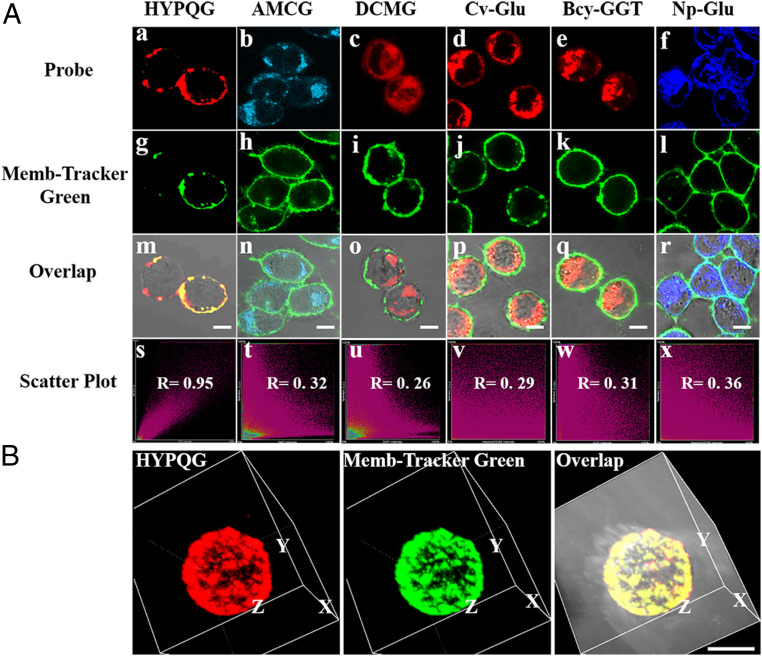
Fig. 3.
In situ imaging of endogenous GGT on the cell membrane with HYPQG and the other five traditional GGT probes. (A) A2780 cells were pretreated with 5 µM HYPQG (a), 5 µM AMCG (b), 5 µM DCMG (c), 5 µM Cv-Glu (d), 5 µM Bcy-GGT (e), or 5 µM Np-Glu (f) for 40 min, respectively, and then cultured with 5 µM Memb-Tracker Green for 10 min (g–l), followed by fluorescence imaging. All overlapping images (m–r) and colocalization images (s–x) of the probe and Memb-Tracker Green, respectively. (B) Three-dimensional reconstructed images after incubating A2780 cells with HYPQG and Memb-Tracker Green. HYPQG: λex = 488 nm, λem = 584–676 nm; AMCG: λex = 405 nm, λem = 425–475 nm; DCMG: λex = 488 nm, λem = 663–738 nm; Cv-Glu: λex = 560 nm, λem = 584–676 nm; Bcy-GGT: λex = 640 nm, λem = 663–738 nm; Np-Glu: λex = 405 nm, λem = 425–475 nm; Memb-Tracker Green: λex = 488 nm, λem = 500–550 nm. (Scale bar, 20 μm.)

